
I read too much. I also entertain too many diverse opinions. Why is this a problem? It is a problem only because I regularly encounter ideas that sound very plausible and are in conflict with what I believe to be true. Sometimes I experience periods of intense doubt, to the point of losing sleep. In my mind, it is better to experience doubt and be open to change than to hold stubbornly to a bad theory. So what was the source of my doubt this month? I heard claims on several different financial podcasts that massive diversification is essential. It’s not enough to hold a few dozen high-quality stocks across different industries. One must hold as many stocks as possible, spanning not only different industries but all of the different geographies on Earth! The podcasters made their claims with such confidence that even a skeptic could be swayed. Unfortunately, the podcasters did not include solid data to back their claims. And so, as is often the case, the skeptic (i.e. me) had to do a bunch of work. I present to you, my reading audience, the results of this work in the hopes it might be useful to you. As is always the case, this is not financial advice so you must not take any action based upon this work without careful and thorough exploration and possible consultation with a financial professional.
In this post, I am going to compare the results of withdrawal policies applied to two different portfolios consisting of equities and gold. The first portfolio will center around one of the largest positions in my portfolio, VYM, which is the Vanguard ETF that tracks the FTSE US High Dividend Yield Index. It contains “only” 410 US stocks selected to be in the top half of dividend payers. Excluded are companies that have not paid a dividend in the past 12 months or have a low or zero forecasted future dividend. It’s true that 410 is a small number compared to the US investable universe of stocks; however, only a small fraction of them are mature enough and financially stable enough to pay a dividend (according to my stock screener there are 6275 common stocks in the United States and 1553 of them pay a dividend). I’m fine not being diversified if it means not owning shares of companies that are not paying me to own them. Speaking of diversification, the other portfolio will center around a fund that is arguably the most diversified a person can get with a single mutual fund. The fund I am selecting is Fidelity’s Multi-Asset Index Fund, FFNOX. This fund consists of 50.08% US stocks (both large and small), 24.21% international developed market stocks, and 10.41% emerging market stocks. It even contains 12.19% US bonds and 3.09% international bonds (the remaining 0.02% is cash). All together it holds 6454 stocks! Just like VYM, FFNOX is passively managed. Its expense ratio is 0.12% vs. VYM’s 0.06%.
Let’s start by taking a look at VYM in isolation. If a person held this fund and no others, what kind of income in retirement would it be able to provide without a person having to worry about running out of money? It’s difficult making any absolute claims because the fund’s inception date was November 10, 2006, but fortunately, the fund launched just prior to the great financial crisis of 2008-2009. Using data that started just prior to the great financial crisis and also spanned the recent global Covid 19 pandemic is a real torture test of any retirement strategy. If anything, this will produce results that are on the conservative side. One should also consider that VYM has a fairly heavy weighting towards financial companies (about 21% currently) and thus would be quite heavily impacted by the financial crisis.
As I discussed in Chapter 12 of my book, the worst thing that can happen to a retiree is to start retirement just before a huge bear market. I also discussed that one of the ways to ensure a portfolio survives a bear market during retirement is to allow withdrawals to vary. In other words, rather than pick a uniform inflation-adjusted dollar amount to withdraw from the portfolio one simply picks an annual percentage amount to withdraw and allow that to vary based upon the market value of the portfolio. So let’s adopt the variable withdrawal strategy. Let’s start with a $1,000,000 portfolio (inflation-adjusted to December 2021 dollars). What annual percentage amount could have been sold over this 15-year time period such that in December 2021 we’d be left with the same inflation-adjusted dollar amount that we started with? It turns out the answer is 6.08%. Withdrawing 0.507% per month (6.08% per year) would have resulted in a $1,000,000 portfolio at the end of December 2021 starting with a portfolio of the same real dollar value at the end of 2006, as is illustrated in Figure 1. As a side note, withdrawing an inflation-adjusted $5,067 per month would have resulted in a real end balance of $558,456, a 44% depletion. This is a heavy cost to pay to ensure a constant withdrawal rate!
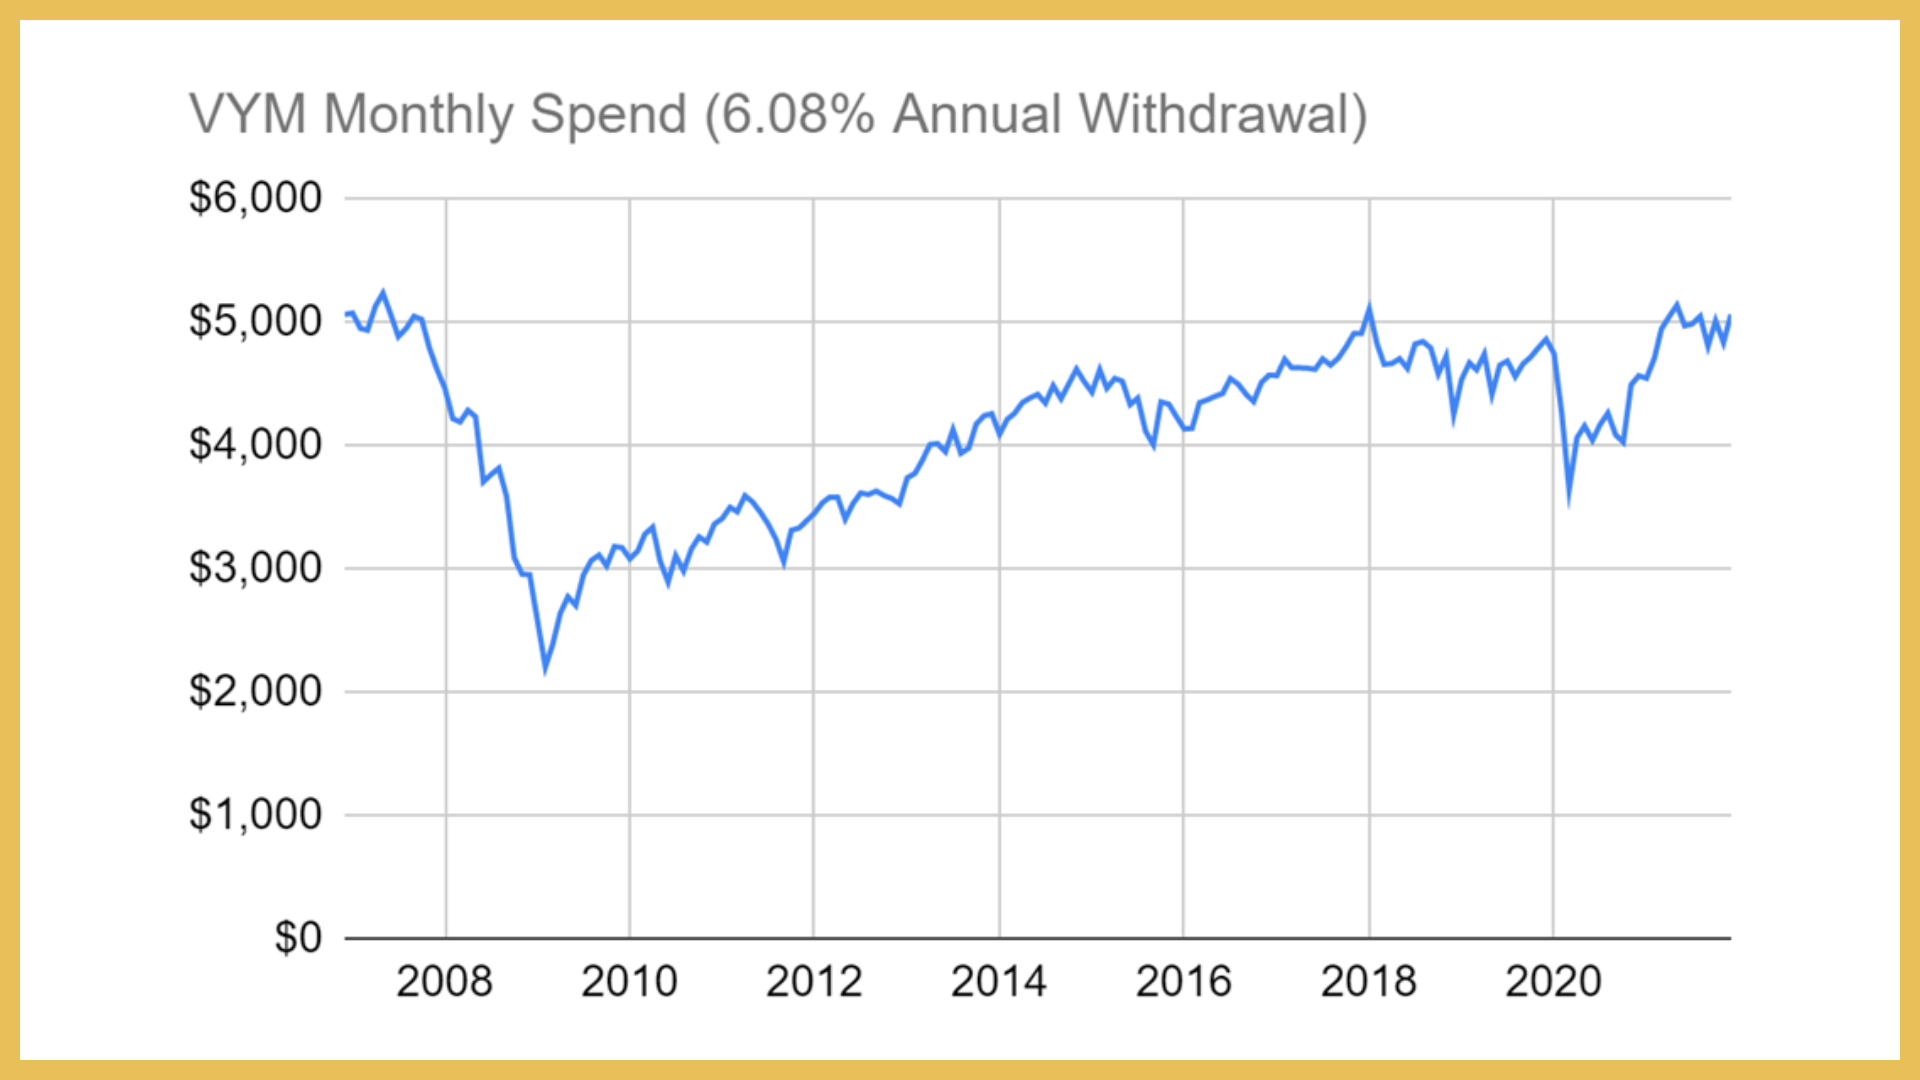
Figure 1: Inflation-adjusted value of a VYM portfolio when 6.08% per year is withdrawn
The variable withdrawal policy is not without its drawbacks. Drawing a percentage of a portfolio rather than a fixed amount removes sequence of returns risk, but it means a person must be willing to tolerate possibly large reductions in portfolio income. Figure 2 illustrates this. Notice that in early 2009 a person would have to be willing to tolerate withdrawing about half of the initial amount, at least for a few months. This highlights the importance of having another asset available to sell (I like gold, but bonds work too) to produce income during an inevitable stock bear market. It’s also a good idea to have other sources of income, such as Social Security. I advocate both!

Figure 2: Inflation-adjusted monthly withdrawals from a VYM portfolio when 6.08% per year is withdrawn
What about massive diversification? What percentage of FFNOX, with its 6454 stocks and 15% diversified bond holding, could we have withdrawn and ended up with the same $1,000,000 real ending value that we started with? Surely the % rate of withdrawal should be higher than it was for VYM and the income towards the end of the bear market should be higher, right?!? Nope. Figure 3 and Figure 4 tell the story.
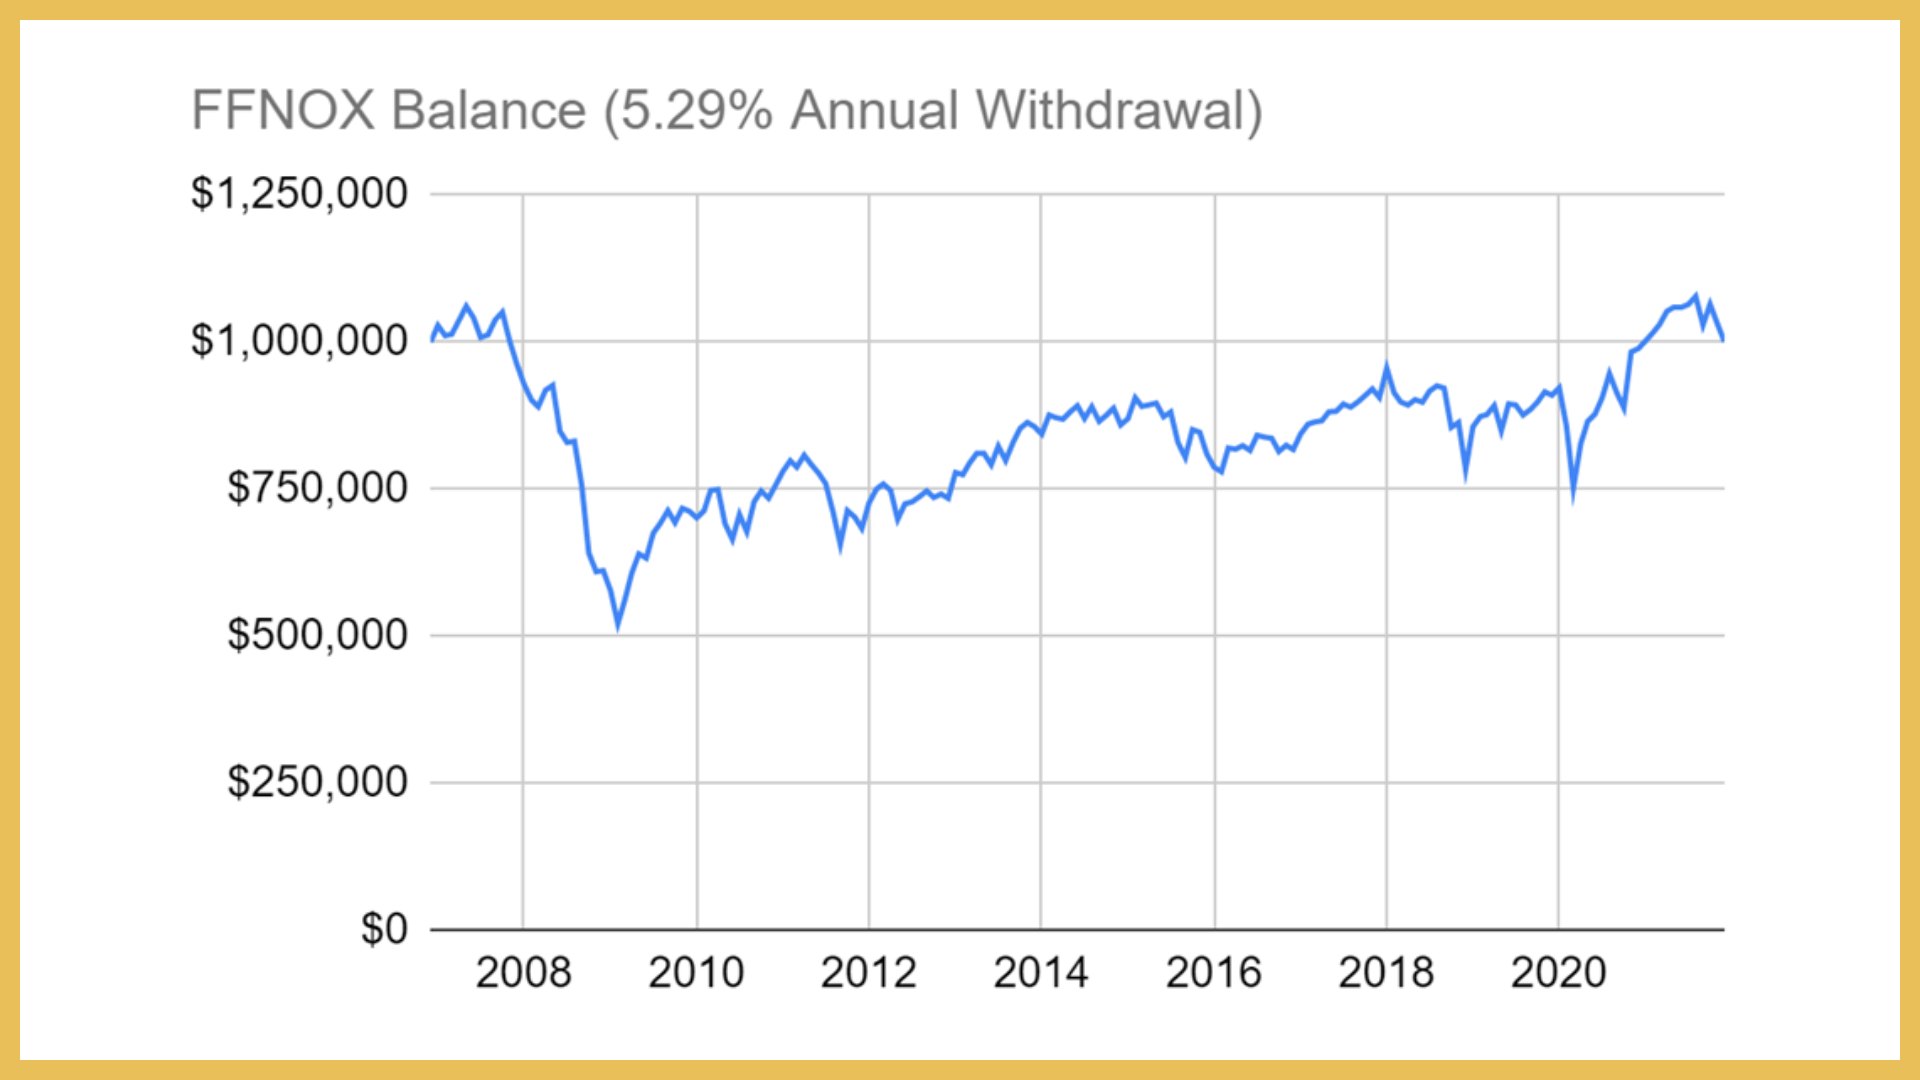
Figure 3: Inflation-adjusted value of a FFNOX portfolio when 5.29% per year is withdrawn
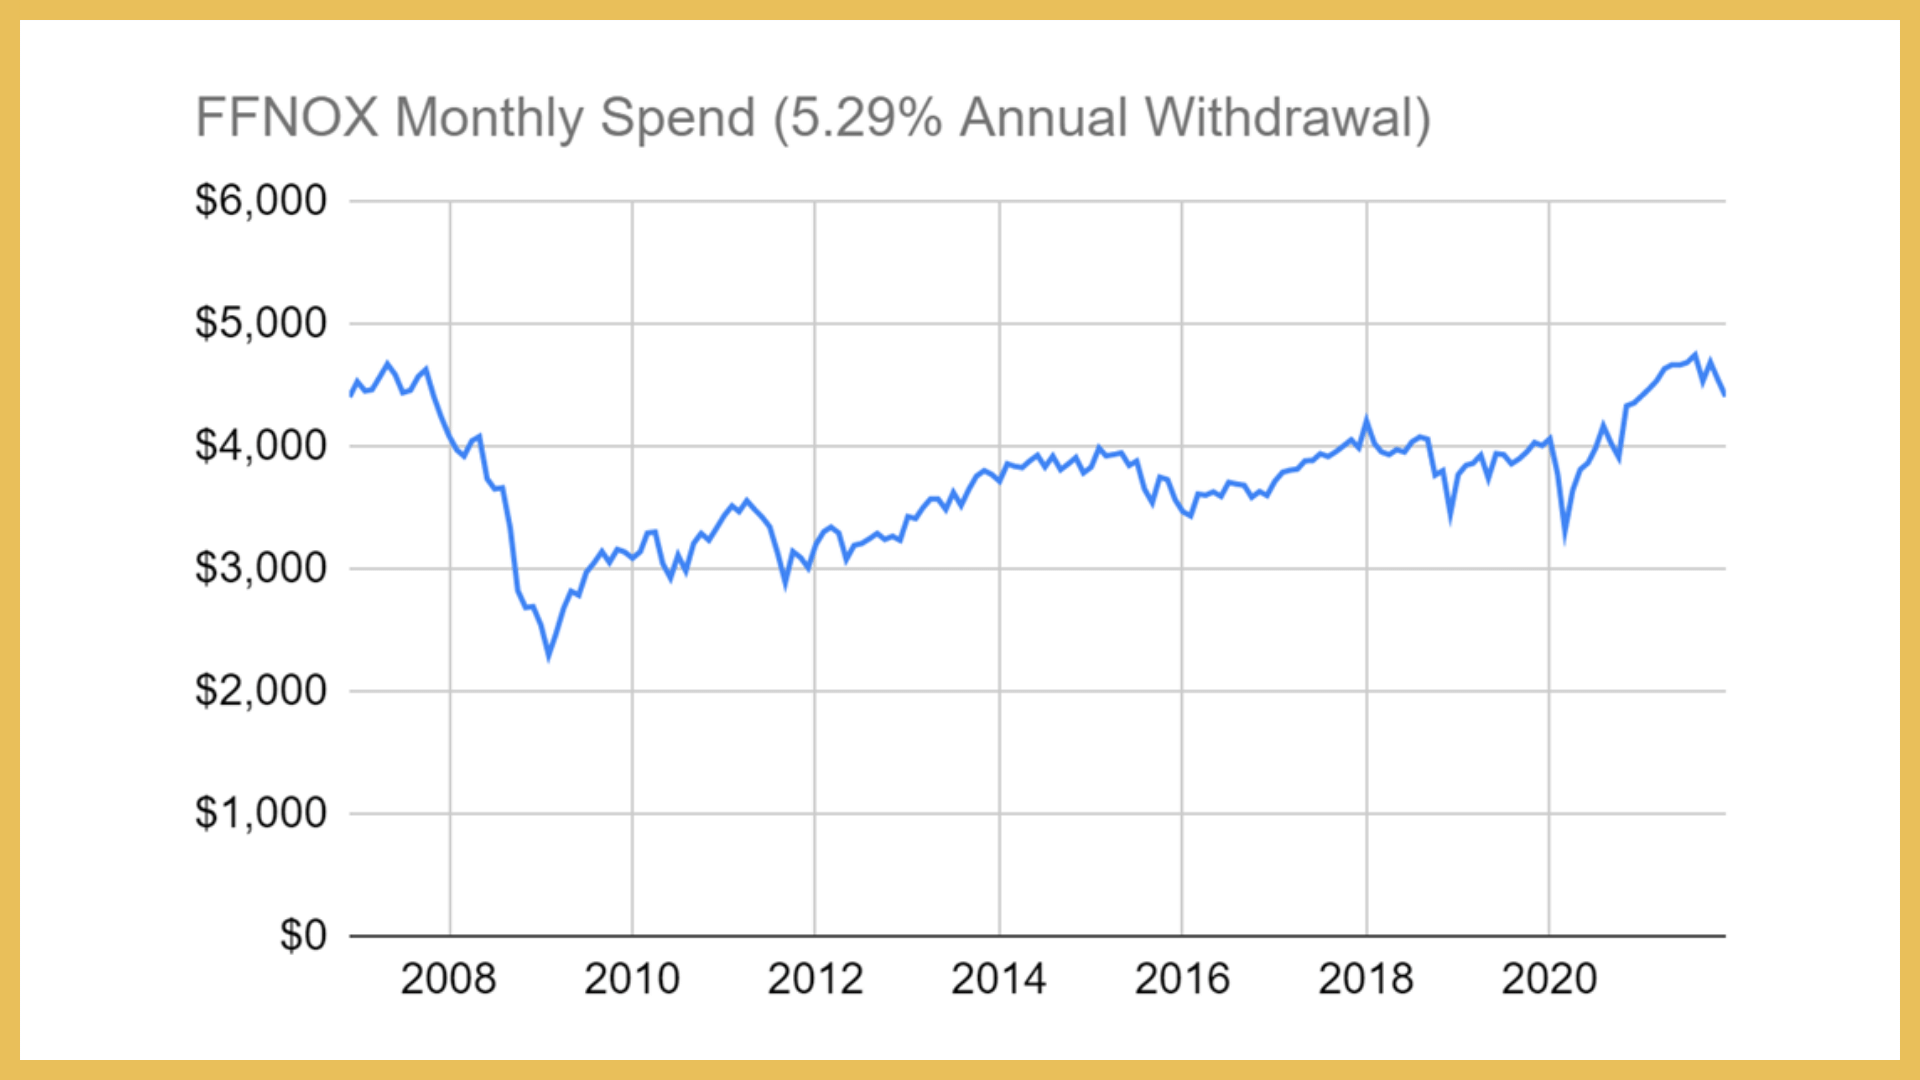
Figure 4: Inflation-adjusted monthly withdrawals from a FFNOX portfolio when 5.29% per year is withdrawn
While we could have withdrawn 6.08% per year from VYM and had the same total value at the end of the 15 year time window as we started with, FFNOX could only withstand a withdrawal rate of 5.29%. As a consequence, the starting monthly income was $4,408 vs. VYM’s $5,067. I have some good news and some bad news. First the good news. The minimum monthly spending level for FFNOX in early 2009 was $2,298, which is 48% less than the initial monthly spend. This compares favorably to VYM whose minimum monthly withdrawal in 2009 was 56% lower than the starting withdrawal. Now the bad news. The lowest monthly withdrawal during the bear market was about the same for VYM and FFNOX. The percentage decline was smaller for FFNOX because the withdrawals were lower during the good times! The average monthly withdrawal for VYM was $4,142 while the average monthly withdrawal for FFNOX was $3,720. So much for the benefits of massive diversification!!! It’s true that by owning the entire universe of investable stocks a person can be sure to own some shares of the world’s greatest companies, but it’s also true that by owning the entire universe of investable stocks a person is certain to own a bunch of (insert your favorite expletive here).
I alluded earlier to the importance of owning another non-correlated asset that can be sold in place of stocks during a bear market. As I discussed in Chapter 8 of my book, the inclusion of gold in a portfolio of stocks tends to make the performance much more predictable and steady on an inflation-adjusted basis, even more so than the inclusion of bonds. I showed that 35% gold with 65% S&P500 stock from 1971 through 2021 produced relatively consistent performance. Did 35% gold mixed with 65% VYM improve the drawdown performance of the portfolio compared with 100% VYM over this specific 15-year window of time? Let’s see. Figures 5 and 6 show the results. They can be compared against Figures 1 and 2. It should be noted that the asset mix is not rebalanced periodically. This is because, as I’ve shown, the anti-correlation between gold and stocks tends to grow as the holding time increases. So rather than re-balance periodically, the withdrawal is satisfied by selling whichever asset is above its target. For example, if in a given month gold is above 35% of the total value of the portfolio then gold is sold. Otherwise, stocks are sold.

Figure 5: Inflation-adjusted value of a VYM + gold portfolio when 6.58% per year is withdrawn. Target allocation for gold is 35%
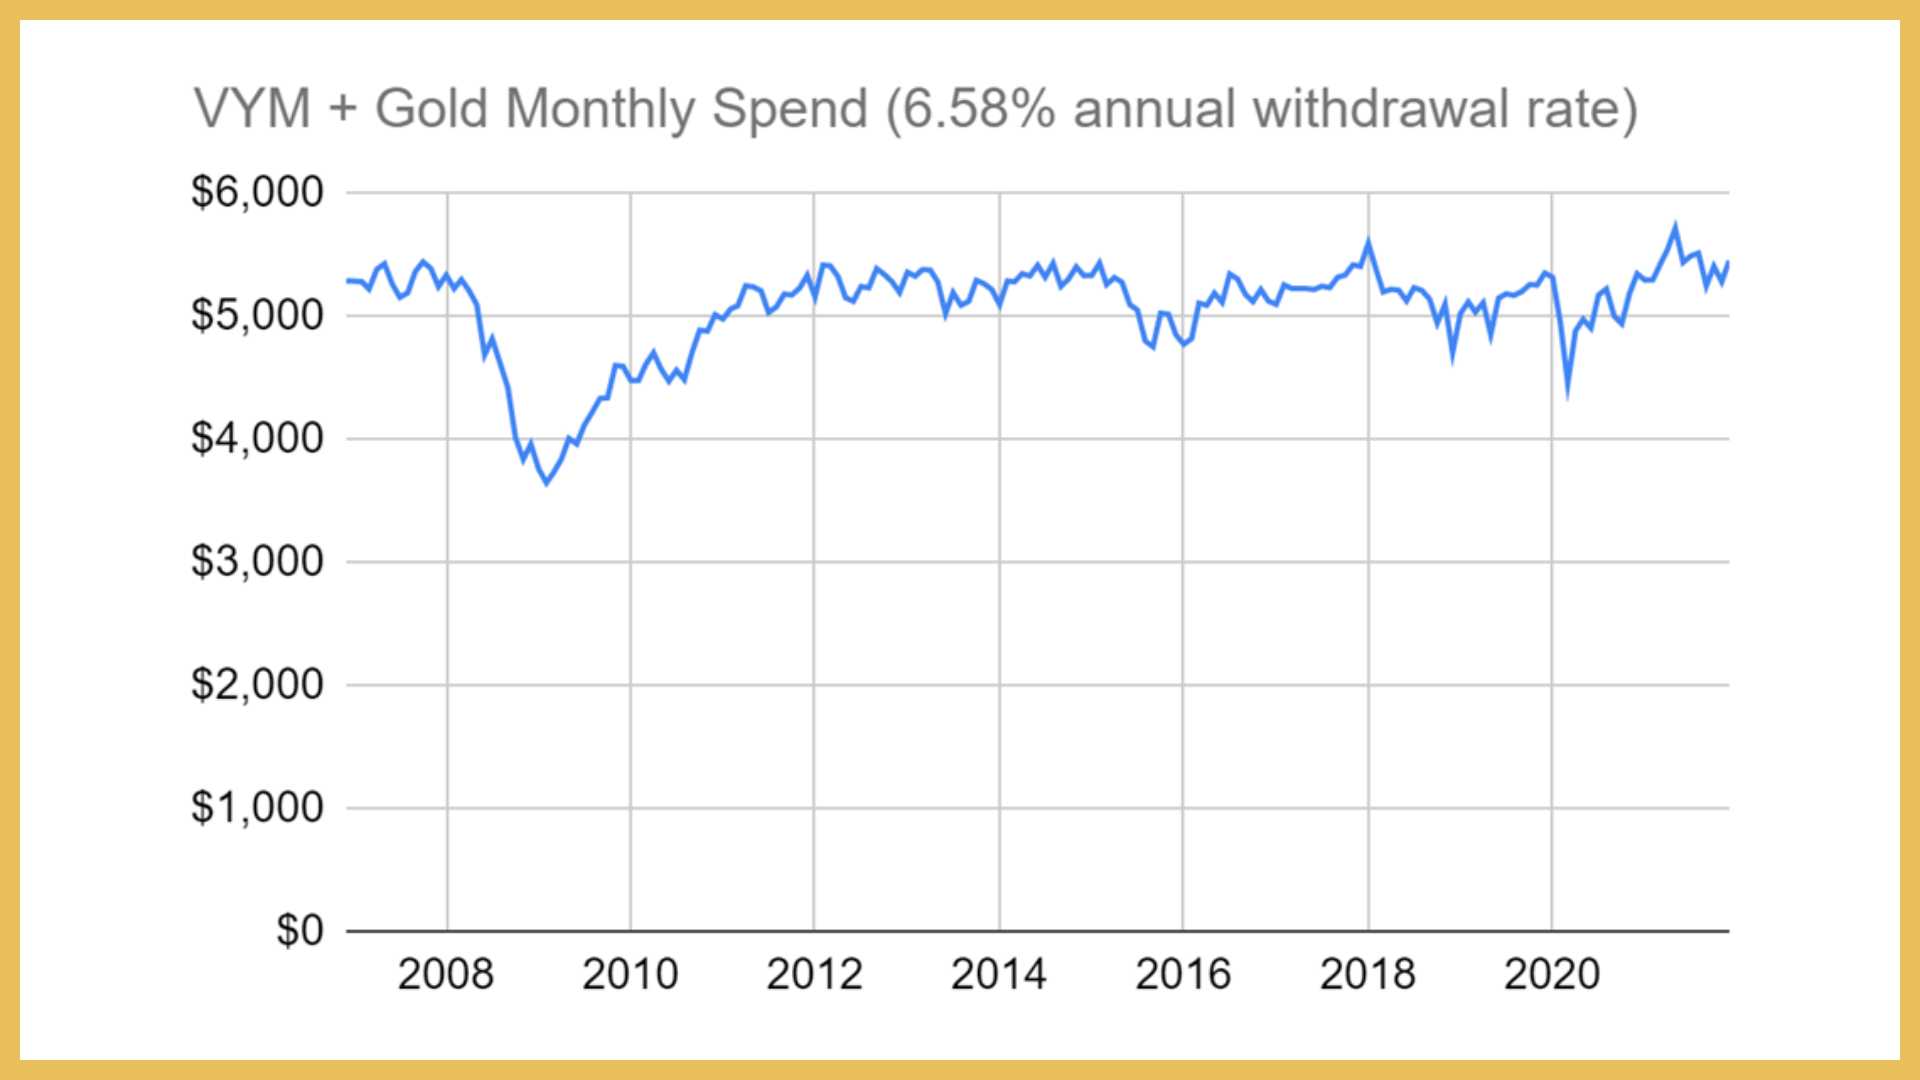
Figure 6: Inflation-adjusted monthly withdrawals from a VYM + gold portfolio when 6.58% per year is withdrawn. Target gold allocation is 35%
We can see right away that the results are much better than they were with VYM alone. Instead of a 6.08% annual withdrawal rate, we could have withdrawn 6.58% per year more when we attempted to maintain a 35% gold allocation. This resulted in an average monthly spend rate of $5,176 instead of $4,142. Clearly, this is a better outcome. Notice also that the impact of the financial crisis was not nearly as severe. The lowest monthly withdrawal in 2009 was $3,649. This compares favorably against the minimum withdrawal of $2,206 for VYM alone. The bear market in 2008-2009 had a much more muted effect when gold was there to provide some ballast.
Many would scoff at having 35% in a portfolio allocated to gold. I don’t blame them. Having ANY gold in a portfolio seems to be a very unpopular idea let alone this much. Then again, I know a lot of people who are so suspect of financial assets that they wouldn’t want to own any stock! When we consider this viewpoint a 35% gold position seems quite moderate. Just the same, let me show you the results of varying the gold amount in the portfolio when a mix of gold and VYM is used. Again, we’ll assume that rather than re-balancing to maintain the % gold target we merely sell the asset that is above its allocation.
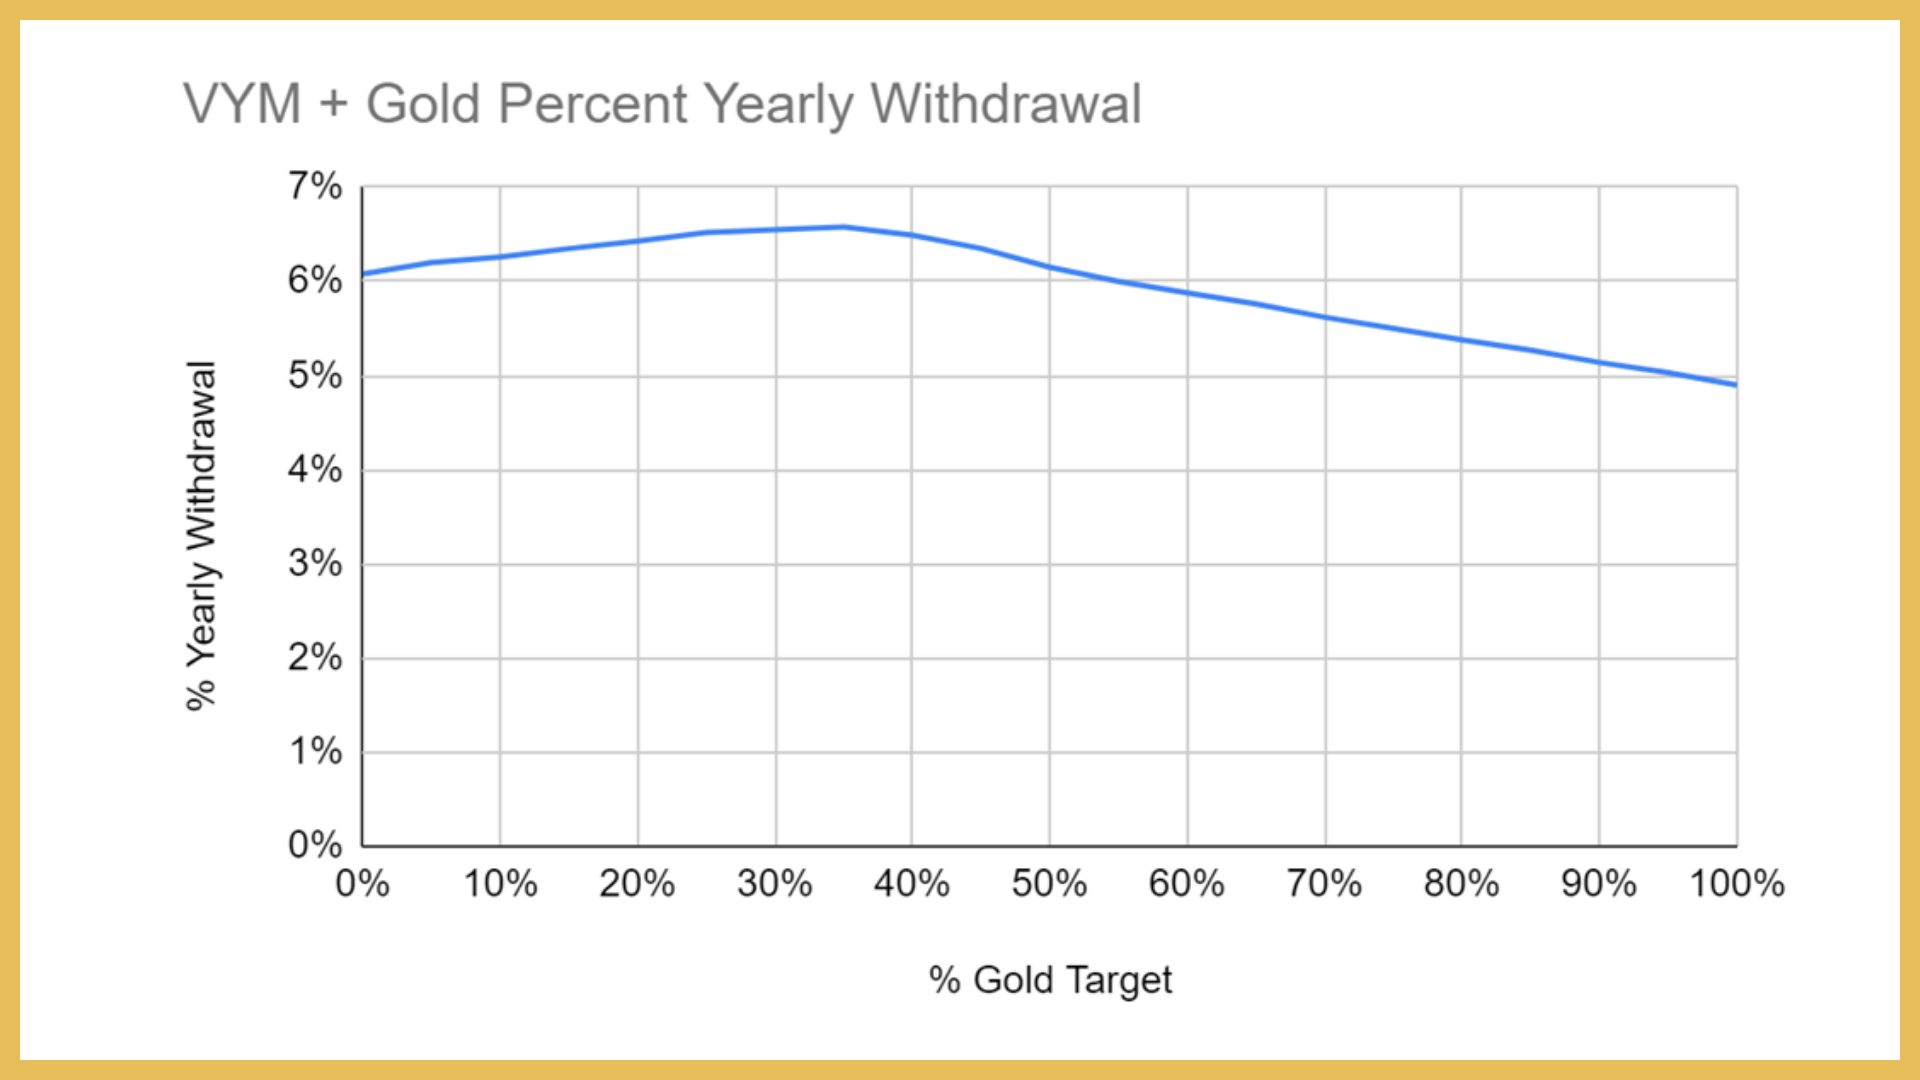
Figure 7: Percent annual withdrawal rate to end up with the same ending real balance as the starting real balance.
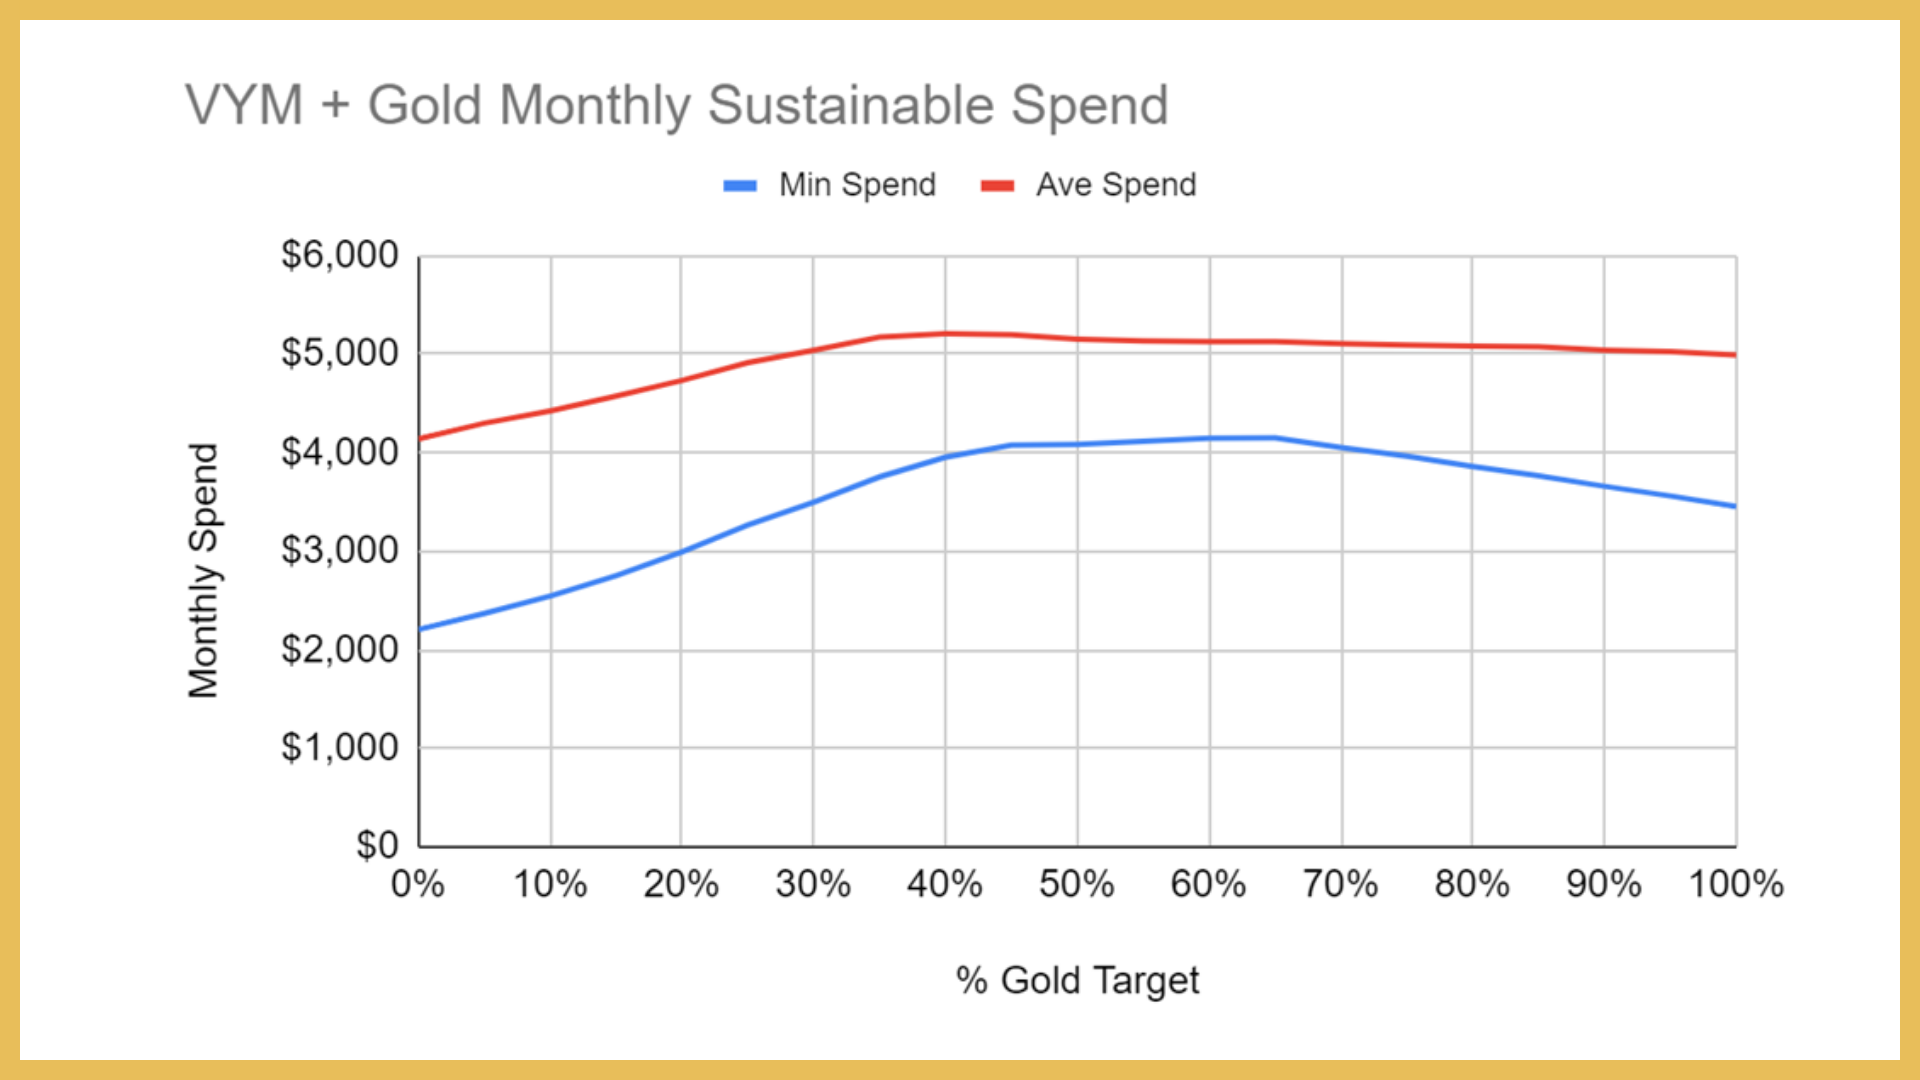
Figure 8: Average monthly spend and lowest monthly spend during this 15-year period for different mixes of VYM and gold.
As Figure 7 illustrates, as gold is increased from 0% to 35% the % withdrawal rate increased. This is consistent with what I demonstrated in Chapter 8 of my book. This is the benefit of having another asset to sell in a bear market. Of course, it helps that this is also an asset that tends to increase in value when stocks are performing quite badly! Above 35% the benefit appears to decrease. This also makes sense because gold is not only more volatile than stocks but it also does not produce income. Looking at Figure 8 we can see the impact this had on the withdrawals from the portfolio. As expected, the average spend rate increased as the gold % target increased from 0% to 35%. Above 35% the average portfolio spend gradually declined. What is somewhat surprising is that the minimum monthly spend continued to increase as the gold % increased. In fact, one would be tempted to conclude that from the perspective of Figure 8 the best result may have been 50-65% gold. I’d hesitate to apply that conclusion going forward because this is a very time-specific study. As I’ve mentioned in the past in my videos I think the right answer lies somewhere in the 20-35% range. But pick your own number, the one that makes the most sense to you.
To be thorough we should conduct the same study with (massively diversified) FFNOX and gold. Does mixing gold with FFNOX change any conclusions? Let’s look at % yearly withdrawal, average monthly spend, and minimum monthly spend. I’ll compare the results when FFNOX is used against the results when VYM is used to represent the stock portion.
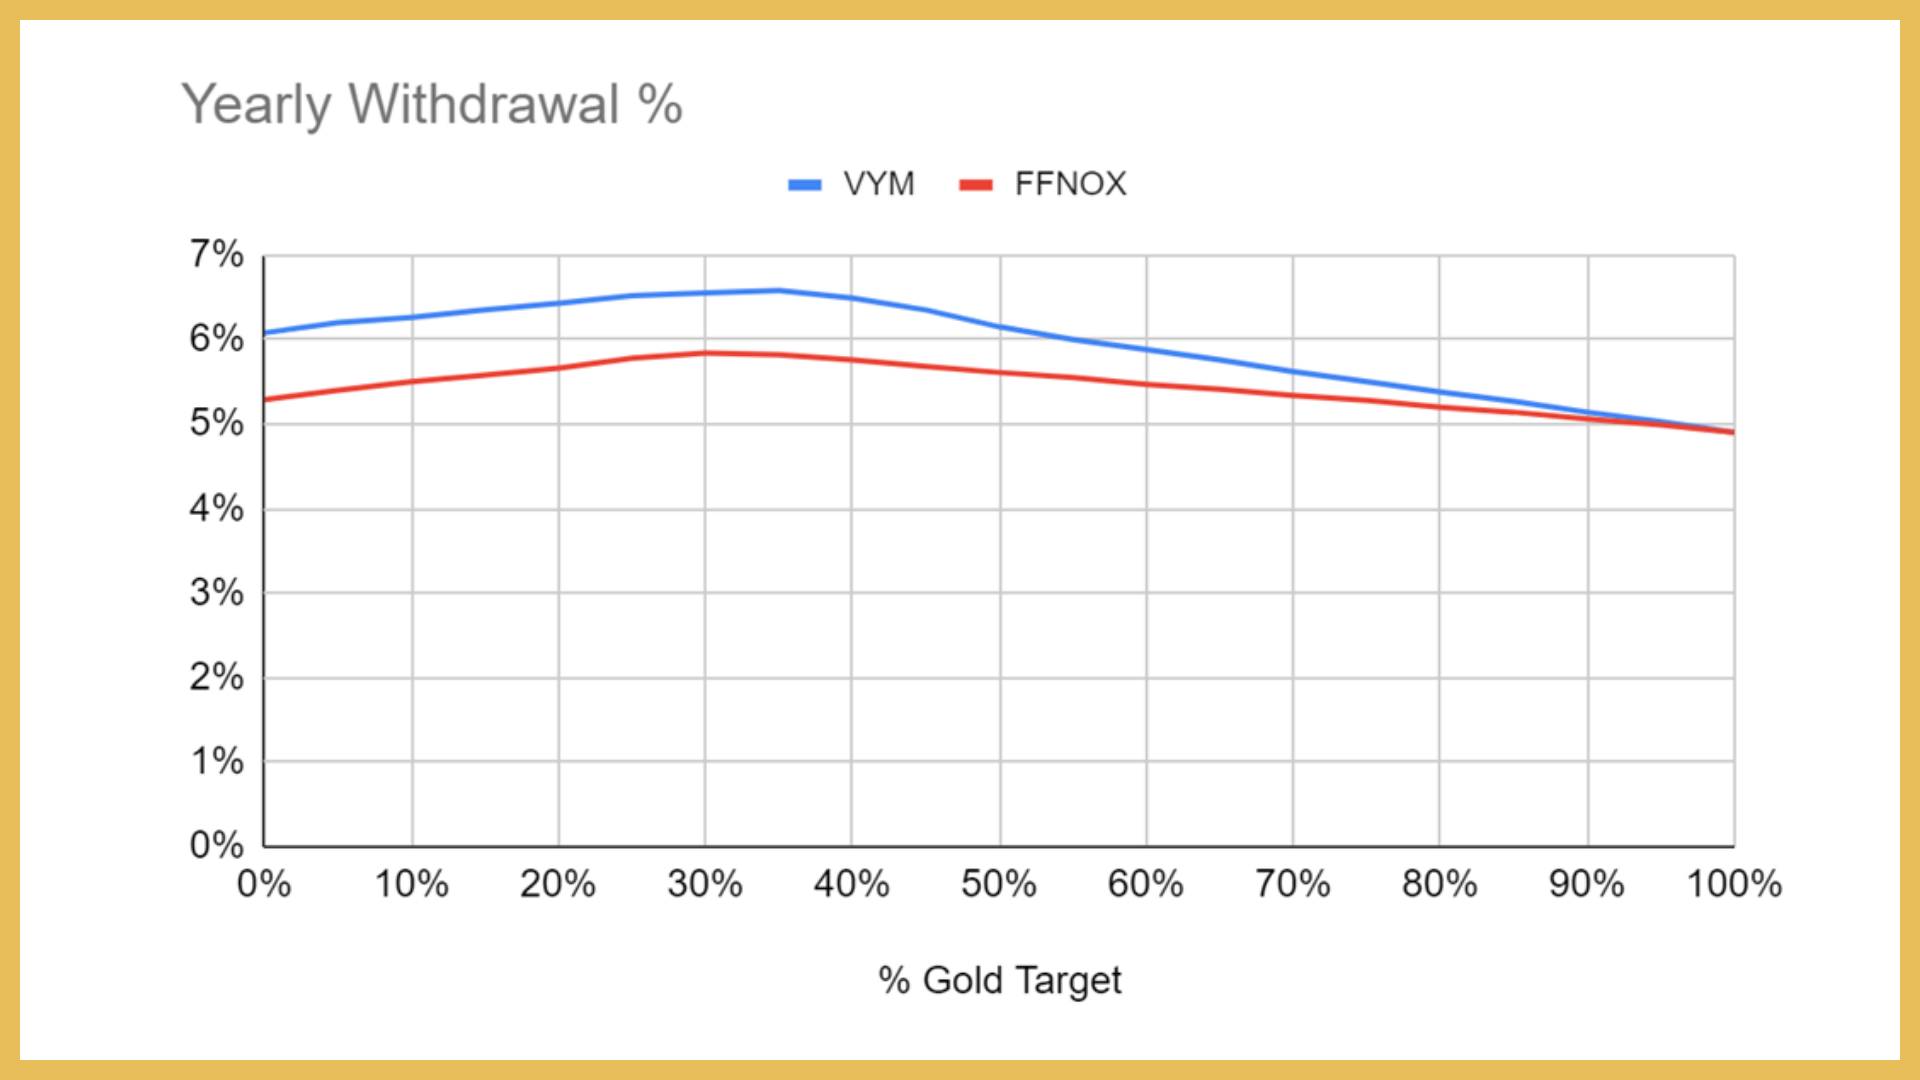
Figure 9: Percent annual withdrawal rate to end up with the same ending real balance as the starting real balance. VYM and FFNOX compared.
As Figure 9 demonstrates, when FFNOX is mixed with various proportions of gold the yearly withdrawal percentage that results in non-depletion of the portfolio is considerably lower. With no gold FFNOX supported a 5.29% withdrawal rate compared to VYM’s 6.08%. As was the case with VYM, adding some gold to FFNOX improved the robustness of the portfolio to withdrawals. The optimal amount of gold was somewhere in the 25-35% range. Naturally, both curves converged at the same point for 100% gold.
Figure 10 shows the average monthly spend for the portfolios. For all amounts of gold, the portfolio using VYM produced more income than the portfolio containing FFNOX. This should not come as a big surprise given the picture shown in Figure 9.
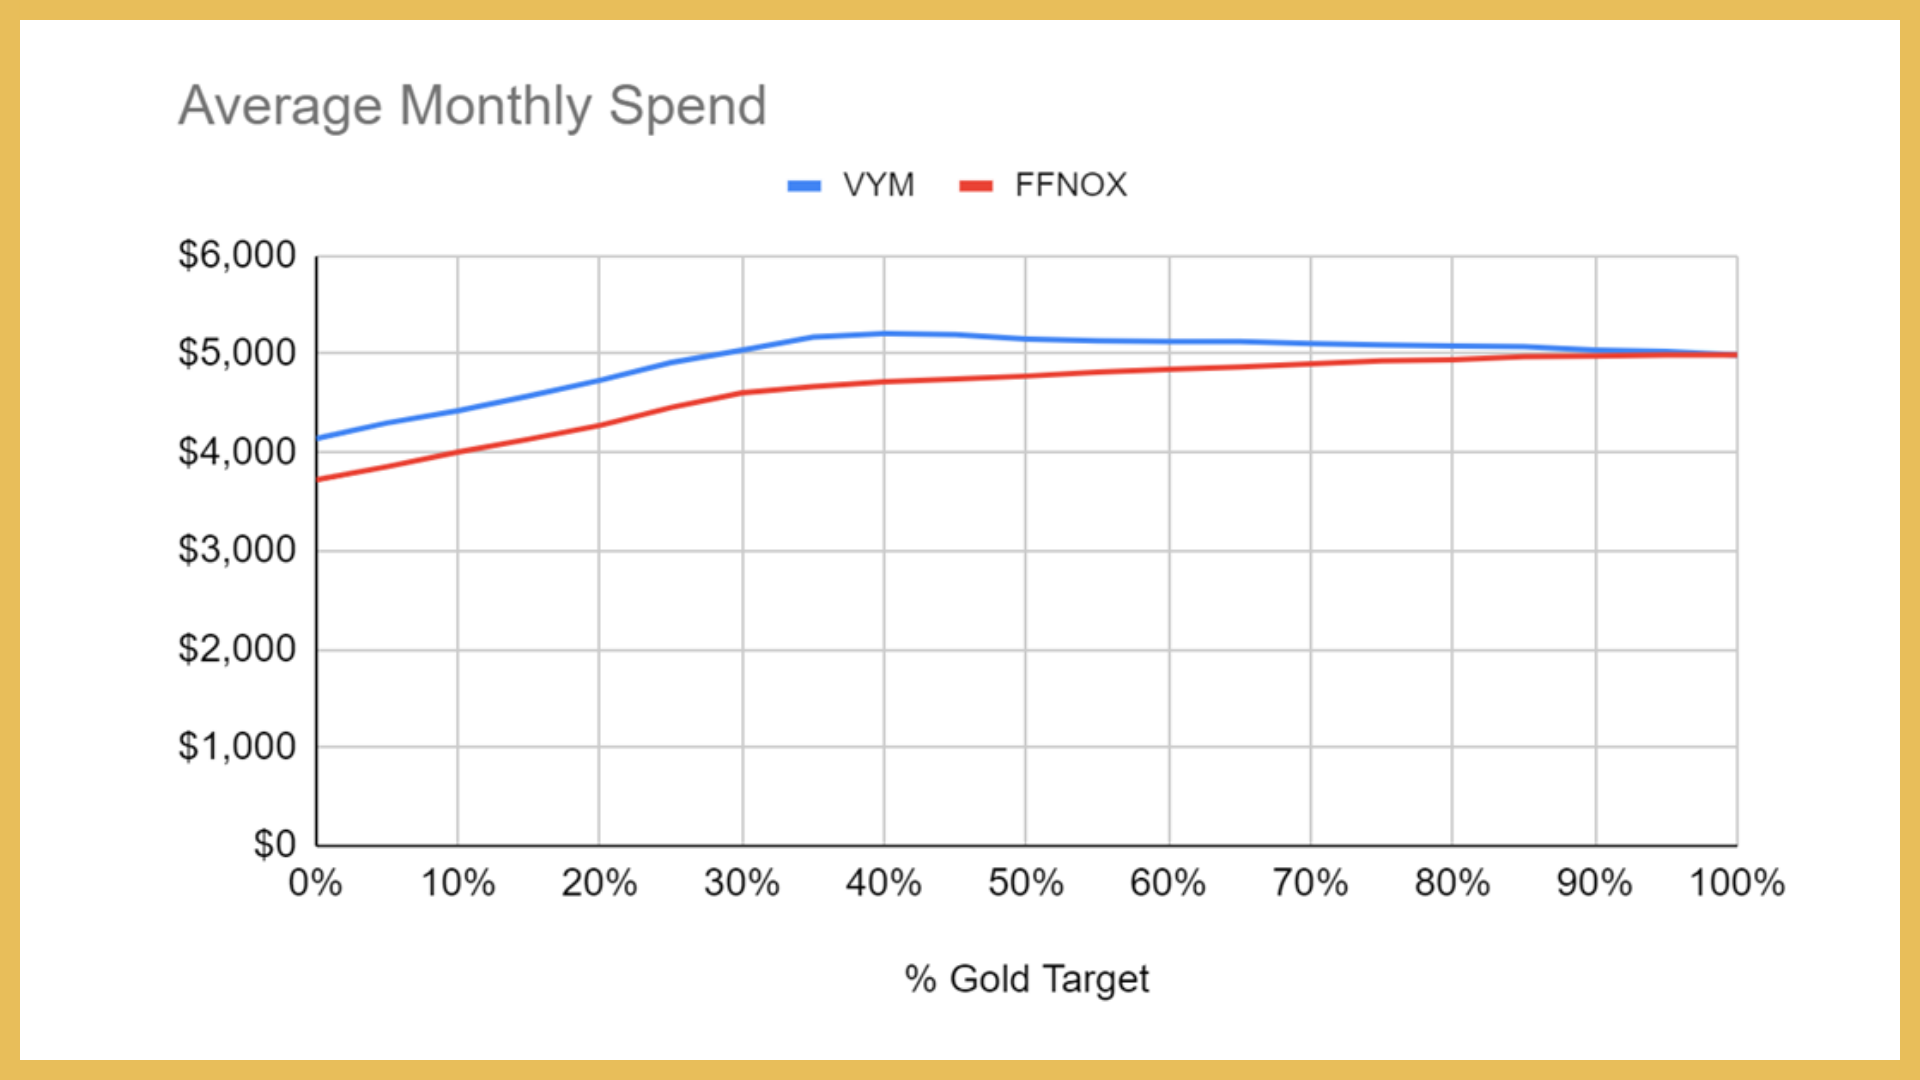
Figure 10: Average monthly spend for different mixes of VYM or FFNOX and gold.
Now let’s discuss the minimum spend level experienced during the height of the bear market. Figure 11 presents this information. Notice that for 0-30% gold the minimum monthly spend was very similar between the VYM and FFNOX containing portfolios. One would be hard-pressed to tell them apart. Above 30% gold, we can see that the minimum spend for the VYM portfolio was better. This is probably not terribly relevant unless the reader is inclined to adopt a gold heavy portfolio. The key message here is that massive diversification did not help in the bear market.
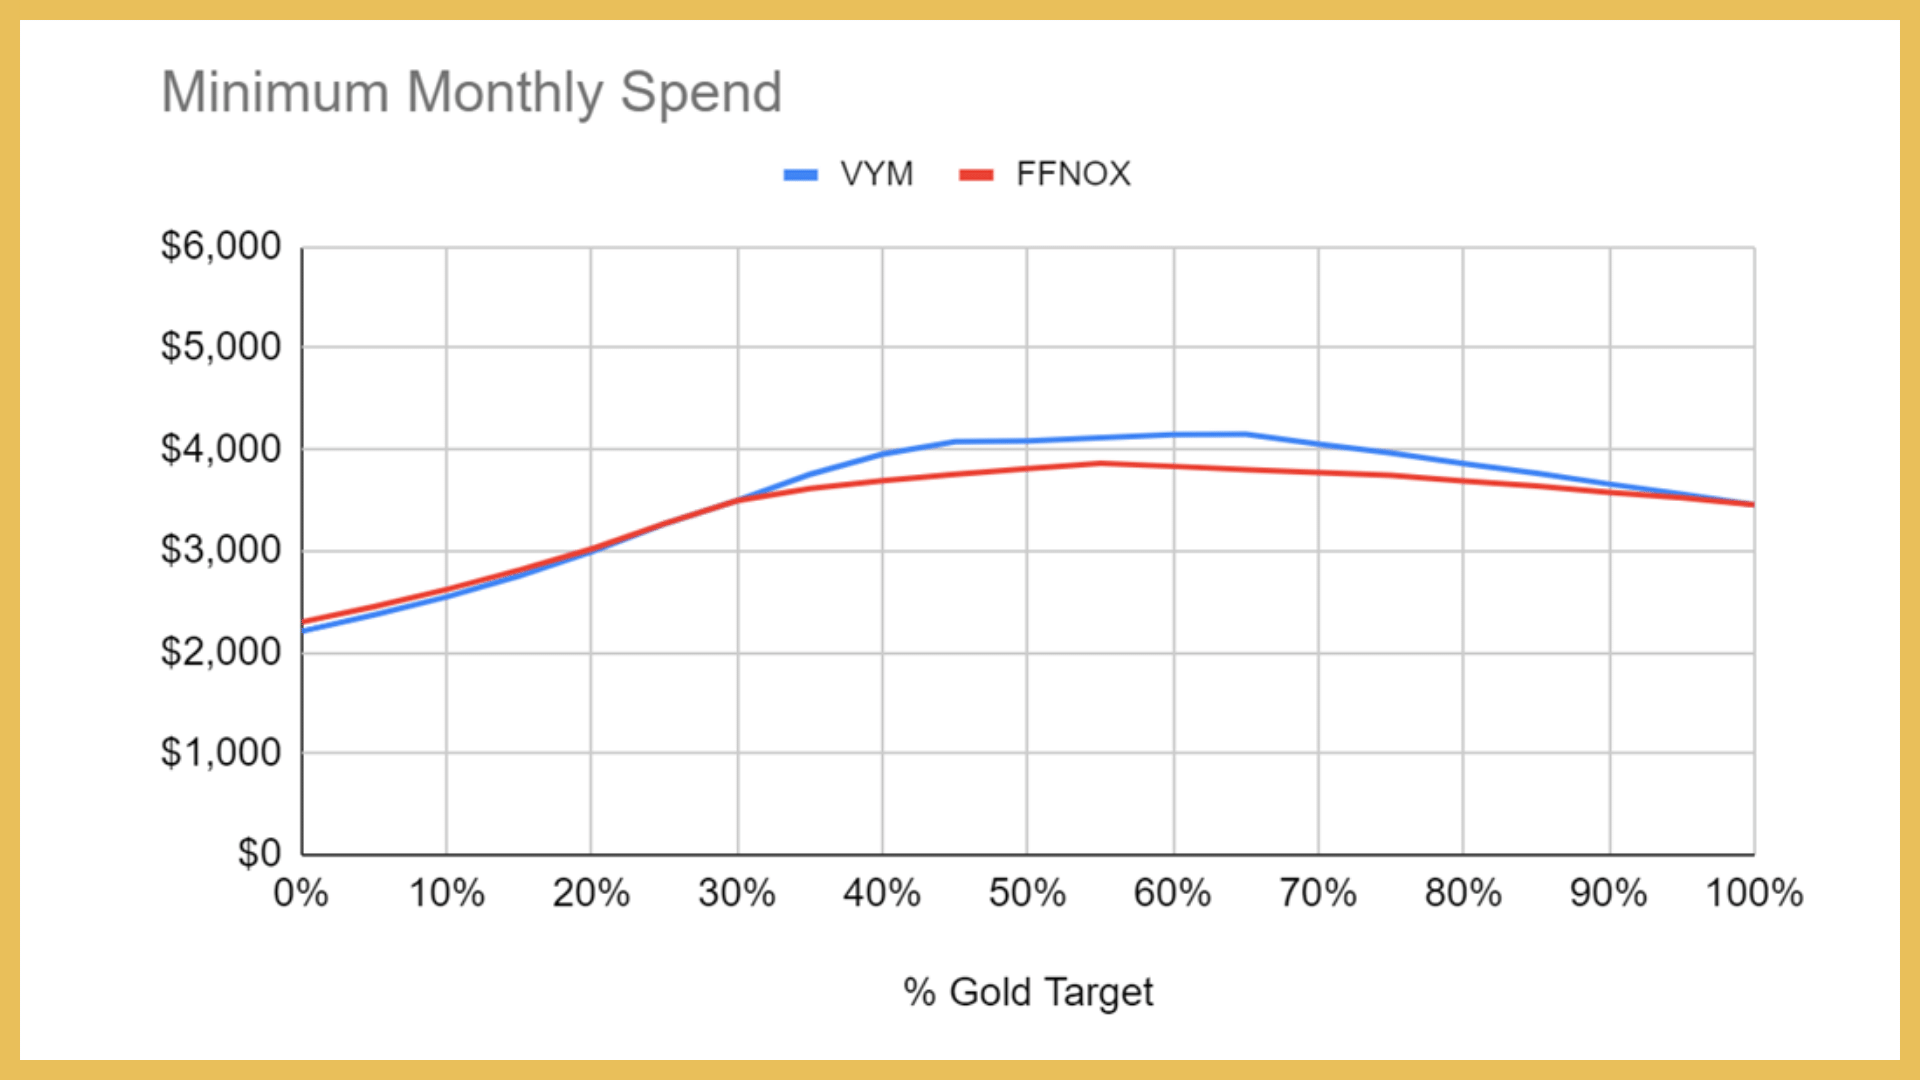
Figure 11: Minimum monthly spend for different mixes of VYM or FFNOX and gold.
So what can we conclude from all of this? The main lesson is that more is not necessarily better. In order to seek maximum diversification, one must be willing to include non-profitable companies, companies that likely will not survive, in the hopes of owning the few gems that will outperform all others. During the financial crisis of 2008-2009 owning a much greater number of stocks, including those of all economic sectors and business geographies, did not improve the robustness of the portfolio. It was the presence of gold that did the heavy lifting. So rather than seek diversification over all of the different types and locations of stocks, maybe it’s time for those in the financial space to embrace diversification over different types of assets, including gold. Gold doesn’t have a pulpit, but it does have a strong track record. For me, I’d much prefer to own strong, income-producing stocks that can perform well in good times and weather the bad while using gold as my financial insurance than to buy everything that is available for sale in the hopes that diversification will bail me out.
You can buy Paul’s book by clicking here: Evidence-Based Wealth – How to Engineer Your Early Retirement if you are seeking to master your financial destiny so that your life will belong to you and not to your employer?
This book will provide you with enough basic knowledge that you can develop and execute your own program for achieving financial freedom at an early age. It will also expose you to some fairly advanced tricks and new ways of interpreting financial information, protecting and building wealth, and planning for short and long-term financial goals.
Disclaimer: This article is for educational and entertainment purposes only. All opinions and information are for demonstrational purposes and do not constitute investment advice. This information is being presented without understanding your specific circumstances or financial situation. If you need advice, please contact a qualified financial adviser, tax accountant, or an attorney, in your country before making any financial decisions.