The yield curve displays the relationship between yields (interest rates) of US Treasury bills, notes, and bonds, having equal credit quality against differing maturity dates. The slope of the yield curve provides an indication of changes to future interest rates, economic activity, and even the future state of the economy. There are three main types of the yield curve:
- Normal (upward curve)
- Inverted (downward curve)
- Flat (sometimes with a hump)
Yield curve rates are published on the US Treasury’s website each trading day.
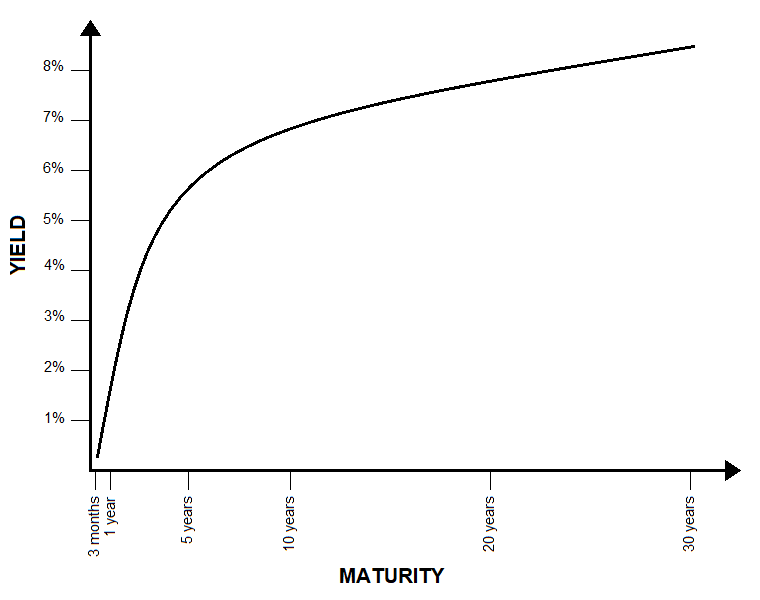
Normal Yield Curve
A growing economy is indicated by an upward yield curve. Short-term bonds typically carry lower yields to reflect investors lower risk endured over a shorter period of time. The longer the investor commits funds, the more risk he is exposed to as the economy changes over time. Therefore, it is generally accepted that an investor’s increased exposure to risk should be rewarded with a higher yield.
A steep increasing yield curve generally indicates the beginning of a period of economic expansion. In a growing economy, it is risky to tie-up investments in long-term bonds as the economy has yet to decline. Consequently, investors opt for short-term bonds, driving yields down and prices up, whilst the abundance of long-term bonds increase yields and decrease prices, to entice buyers.
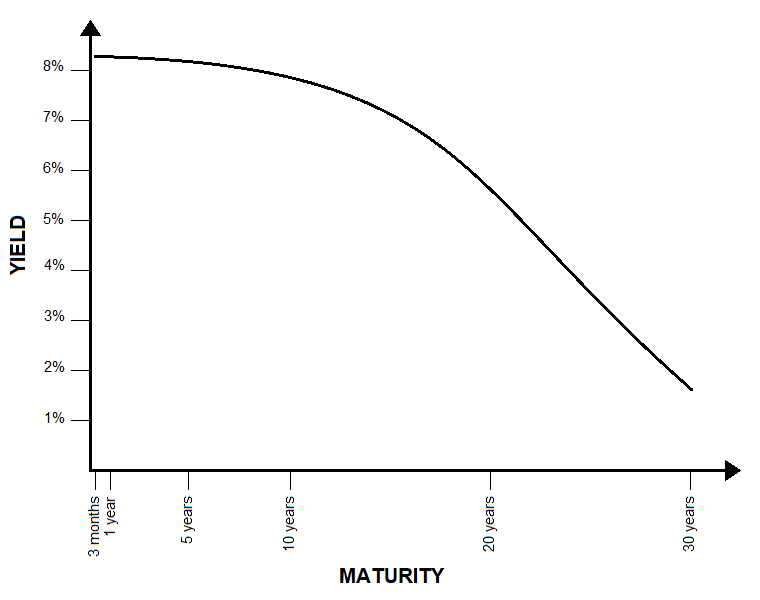
Inverted Yield Curve
In addition to markets expanding, markets can also go into recession. An economy that is heading for recession is indicated by a downward, inverted yield curve. Lower interest rates generally indicate that economic growth is slowing, and investors often assume this to be a sign that the economy may soon stagnate. In such circumstances, investors clamour to lock in current yields by purchasing long-term bonds before they begin to decrease. In doing so, they tend to become more tolerant towards prices and yields.
Such behaviour creates a lack of demand for short-term bonds, leading to lower prices and higher yields for short-term bonds, and higher prices and lower yields for long-term bonds, thus creating the downward, inverted yield curve.
Remember, correlation does not always equate to causation. An inverted yield curve is not necessarily a perfect and reliable indicator of a looming economic recession. So, always perform your analysis of the yield curves in context with other economic signals.
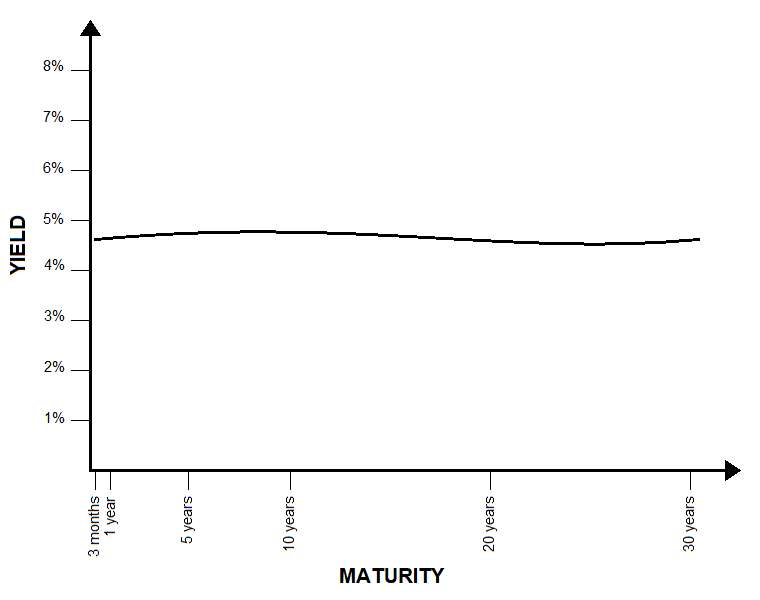
Flat Yield Curve
A flat yield curve might follow a normal yield curve or an inverted yield curve, indicating a change in economic direction. Whilst the economy is transforming from expansion to slower growth and possible recession, yields on long-term bonds tend to fall and yields on short-term bonds are likely to increase, inverting a normal yield curve into a flat yield curve.
Conversely, when the economy is transforming from recession to recovery and possible expansion, yields on short-term bonds tend to fall and yields on long-term bonds are likely to increase, tilting an inverted yield curve towards a flat yield curve.