Most of the financial news I have been reading lately has been focused on reasons a person might want to sell their equities: sharply higher consumer price inflation, the Federal Reserve continuously raising interest rates, Vladimir Putin threatening the use of nuclear weapons, a disastrous earnings announcement from Federal Express, Michael Burry (you know, “the Big Short”) calling for an epic market crash, and the list goes on. Some other news trumpets the failure of gold as an inflation hedge (isn’t there always a reason to degenerate gold?). Still, other news talks about a real estate market crash being right around the corner. So what is a person to do? Sell everything and just buy iBonds and TIPS? I’m sure my audience would like to hear my thoughts on all of these issues. I will certainly be providing an opinion soon on some of these current events, but first I wanted to discuss something much more important. What is the cost of waiting to invest?
Today I’d like to talk about something that is incredibly important for everyone to understand. When it comes to building wealth, the biggest cost you will face is the cost of waiting to invest. I don’t think the enormity of this cost is appreciated by most people, which is why I am going to quantify it for you. There will always be an event, or in some cases just an overblown theory, that will serve as a reason to believe it is the end of the world as we know it, a reason to just stay on the sidelines and avoid any but the safe haven dujour.
I’m certainly not going to shrug off current concerns as irrelevant; however, sometimes I like to reflect back on how some people must have perceived history as they lived it compared to how they felt about those events years afterward. I, myself, felt a strong sense of fear about events over the past 40 years as I experienced them. The past is full of war, conflict, viral pandemics, assassinations, political scandals, and financial scandals. Let’s list a few. World War 1 was the war to end all wars. World War 2, the sequel 20 years later, was larger and far more deadly. Sandwiched in between them was the Spanish Flu Epidemic that killed between 17 million and 50 million people according to the historical record. This is far more than the number of people reported to have died from Covid-19 and at a time when the world population was much smaller than it is now. We had the cold war, a period of multiple decades where people feared the world could end from a giant man made fireball. The closest we came to an actual nuclear exchange between the superpowers was the Cuban Missile Crisis in 1962. John Fitzgerald Kennedy, a very popular US President was assassinated in the early 1960’s, leaving many wondering what it meant for democracy in the US. His brother, Robert Kennedy, by the way was also killed several years later. Let’s not forget the assassination of civil rights leader Martin Luther King in 1968 during the long-running civil rights struggle, not many months after the violent riots in Detroit. All the while we had a very unpopular war, the Vietnam War, which led to countless casualties both at home and abroad. Peaceful protests were met with violence. For example, in 1970 the Ohio National Guard opened fire on unarmed protesters at Kent State, killing four and wounding nine others. The Watergate hearings in the early 1970’s threatened to remove President Nixon, who ended up resigning. Also in the 1970’s was an oil crisis that sent the price of oil sky high and caused long lines where people waited for hours at filling stations to put gasoline in their cars (when gasoline was available). The AIDS epidemic of the 1980’s was a new and scary virus of mysterious origins. Eventually, scientists learned what caused it and the population learned how to protect themselves from exposure, but I remember the news stories that suggested everyone could end up perishing from it. In the early 1990’s we had more race related riots in Los Angeles. The latter portion of the 90’s saw impeachment hearings brought against what was at the time a fairly popular sitting president. 2001 ushered in the era of the surveillance state, when the twin towers (as well as tower 7) collapsed after two jet airliners collided with the buildings. The World Trade Center event was the catalyst for military action and occupation of Iraq and Afghanistan. There is still much controversy surrounding the event and subsequent military actions. In 2008 the money market nearly froze and the housing market collapsed as a result of a long period of undisciplined mortgage lending and bundling of bad loans with good in order to provide a higher debt quality rating than was warranted. In the early 2010’s we had the outbreak of Swine Flu (another H1N1 virus like the Spanish Flu). The press promoted it as a potential global catastrophe.
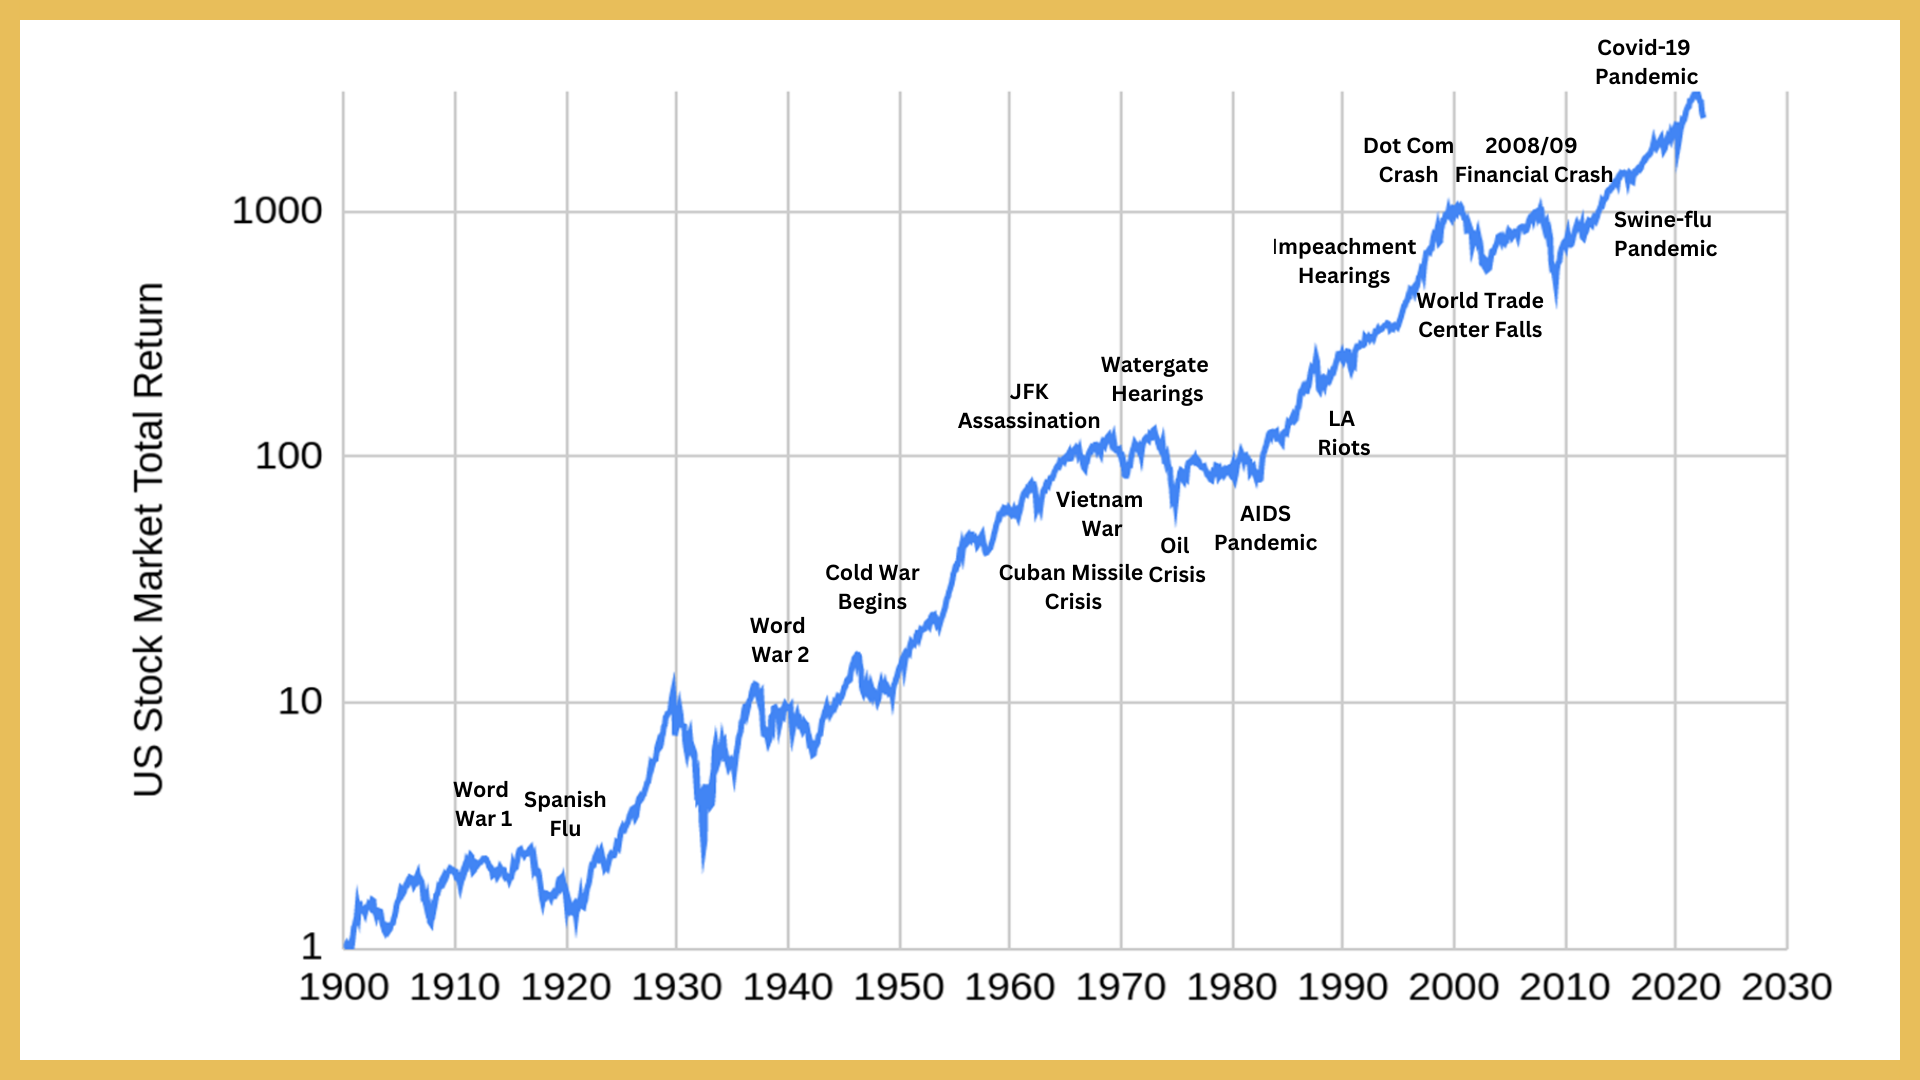
I could go on and on. We have had many, and I mean MANY, scary events in the past which at the time threatened the end of the world as we know it. Maybe if fortune hadn’t smiled upon us the world would have ended. Who knows. But think about how expensive it was for those who decided to exit all risk positions to avoid what was perceived to be a global calamity. Throughout all of these events the US stock market, with dividends reinvested, has increased in nominal terms by nearly 2500 times.
The big challenge facing people is when does it make sense to invest and when is it best to just sit on the sidelines? If only there was a way to know for sure, what is the cost of waiting to invest? Looking back at history, some of the biggest market rallies occurred shortly after some of the scariest events. Who would have thought that a decade that began with near nuclear annihilation and the assassination of a very popular president, one whose signature was race riots and an unpopular war, would be a good time to be in the market? Who would have thought that the decade following the 2008 financial crisis would be so good to the market? It seems to me that the returns offered by the stock market are more a function of how much a person pays for its earnings than what current events suggest about prospects for earnings growth. Dalbar has reported that over the past 30 years the S&P500 has returned 10.65% annualized but that the average equity fund investor has only earned 7.13%. Where did that extra three and a half percent go? Certainly some of it has been given up in management fees, but I’d argue that most of it was missed because investors overreacted to the events of their time. Lest you think that three and a half percent is not significant, over 30 years the average equity fund investor would have seen an investment of $100,000 nominally grow to $790,000. Just leaving the same money untouched in the S&P500 would have resulted in an ending nominal value of over $2 million!. That’s a big price to pay for being reactionary!
A Framework for Understanding Opportunity Cost
Of course, this still doesn’t answer the question “Is now a good time to be in or out?” Dalbar’s report only focuses on past results. Nobody can buy past results. We can only buy future results. What is the cost of waiting to invest? We need a fundamental way of examining this question. Stocks have a strong element of speculation built into them, so let’s start with something that can be treated with precision. Let’s start with bonds and then look at equities. *** Caution: bond examples and bond math can be boring, but the illustration will be very instructive for understanding equities! ***
We are currently in an environment of great trepidation when it comes to interest rates. It seems that although everyone understands that bonds can decline in value when interest rates rise, only now are people treating this risk seriously. I guess decades of falling interest rates can do that (that is desensitize a person to risk).
I’ve seen comments from many indicating so much fear about rising interest rates that they would prefer to keep their emergency fund cash in a money market or savings account than in anything that could lose value if interest rates rise. How much is a person giving up by doing so compared to a person who is willing to buy a 1 year US treasury bill? Let’s put some numbers to it. Right now, a 1 year US treasury bill yields 4.1%. Many high yield savings accounts and treasury money market funds earn about 2%. What is the cost of avoiding any price fluctuations?
Suppose your emergency fund is $10,000. Option 1 involves the purchase of treasury bills. Treasury bills are purchased at a discount and then they mature at face value. $10,000 face value worth of treasury bills can be purchased for $9606.15. When the bill matures, the $10,000 payment will represent a 4.1% increase in the money used to purchase the bill. Of course, this leaves $393.85 left over after the initial purchase. So let’s place this money in that money market fund. At the end of the year how much money will be in the emergency fund? The bill will be worth $10,000. The money market holding the money that couldn’t be deployed when buying the bills will hold $401.73, assuming monthly interest was paid. All totalled, this option results in an ending value of $10,401.73.
So what about the money market option? This is option 2. For starters, let’s see what would happen if interest rates DO NOT RISE over the rest of the year. This will serve to bound the difference in outcomes. If we place the entire $10,000 in a 2% money market with a stagnant interest rate then at the end of the year the balance will be $10,200. This is a full $201.73 lower than the treasury bill option. Lots of people would say “so what?” to the $201.73 shortfall. I’d counter by saying “That’s the cost of a really nice dinner for two. You wouldn’t pass up an opportunity at a free dinner for two, would you?”.
Ah, but here’s the rub. It’s not really a free dinner, is it? The person who buys the treasury bill is taking on some risk, and the $201.73 is payment for taking on that risk. But what is that risk exactly? It is the risk that the treasury bill will need to be sold on the secondary market to meet the cost of some unknown emergency, and that the value of that bill at that time might be lower than when the bill was purchased. How can we quantify this risk?
It turns out this is not too difficult to do with fixed income instruments, which is why I’m doing this exercise before moving on to stocks. Let’s fabricate a scenario. Let’s assume that some unexpected cost comes up at the 6 month mark that requires all of the money available in the emergency fund be liquidated. Let’s further assume that general interest rates rise by 0.5% next month followed a month later by another 0.5% rise and then they stay stagnant.
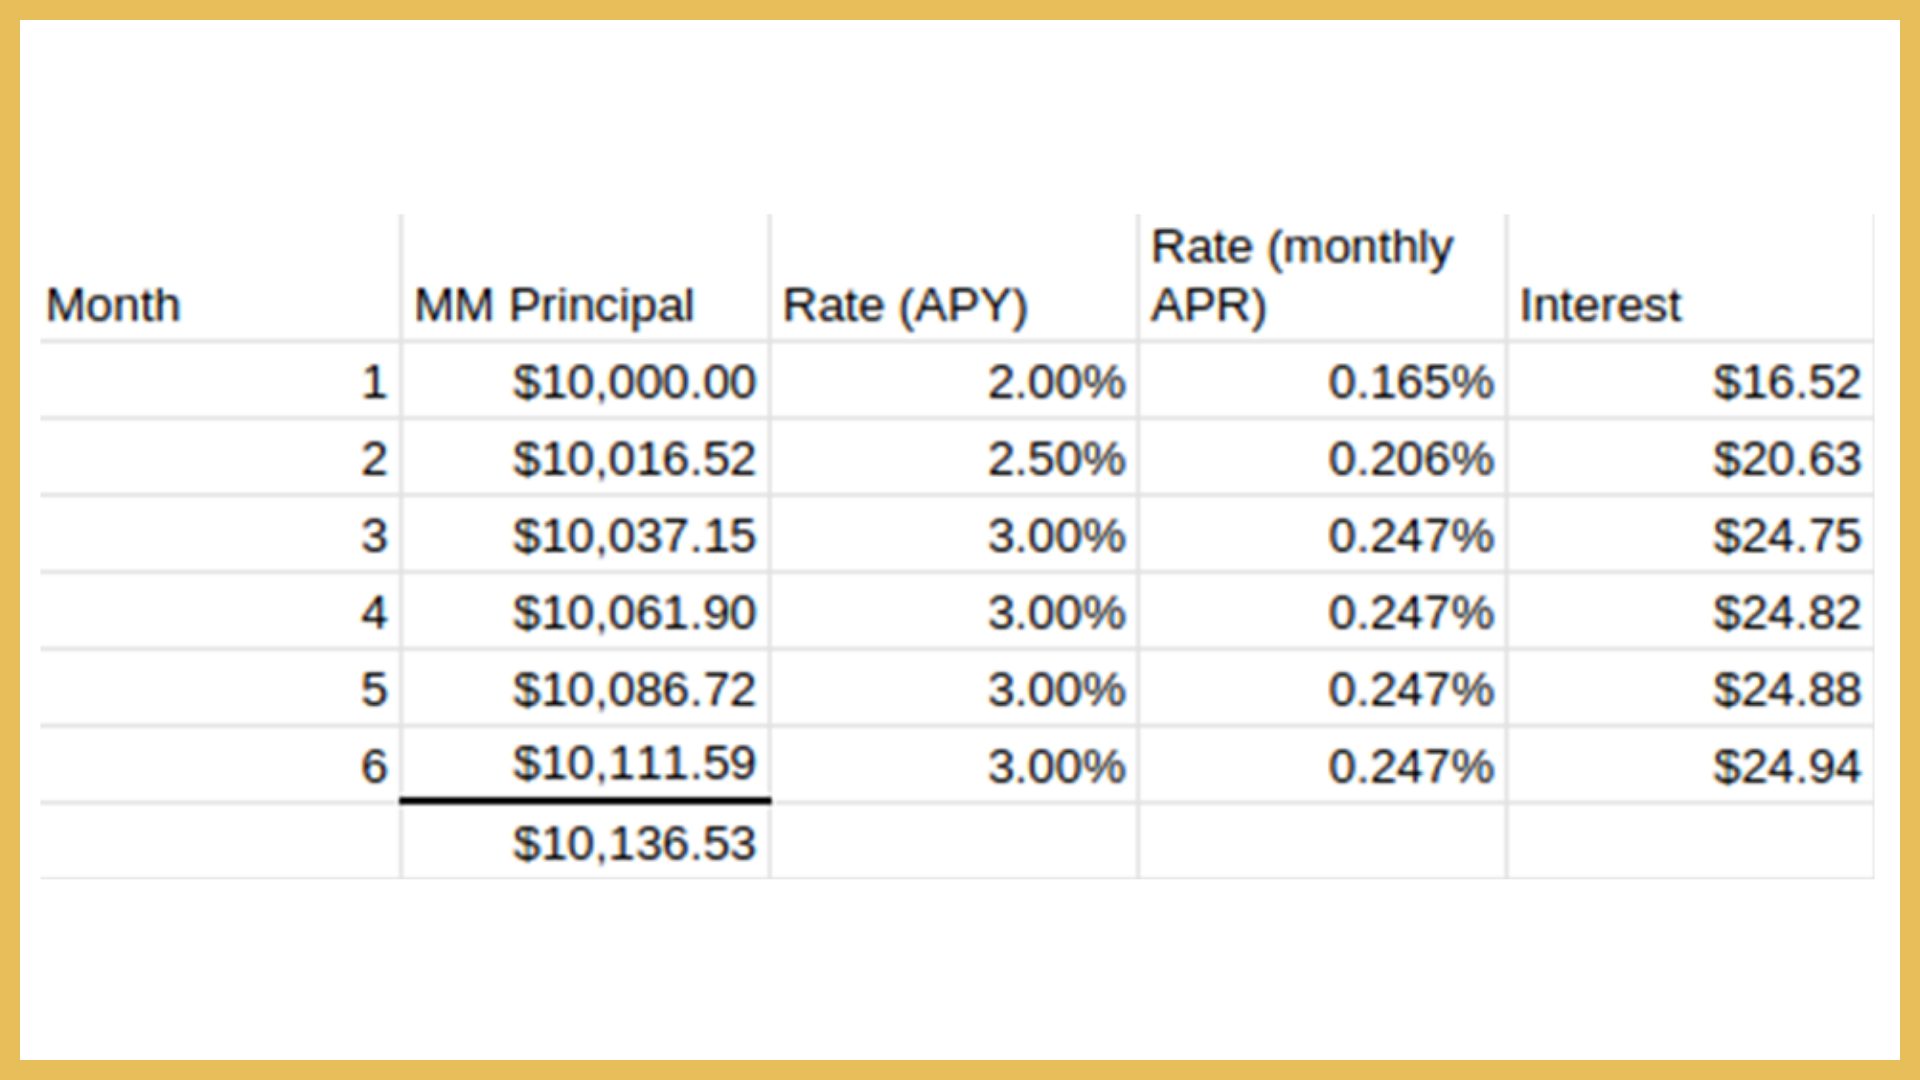
At the end of 6 months the money market, with these assumptions, will have grown to $10,136.53. How much will option 1 be worth? Surely the Tbill will have lost some value because interest rates climbed quickly and it needs to be sold 6 months prior to maturity. OK. Let’s keep the value of option 2 in the backs of our head and work on estimating the value of option 1. Remember the $393.85 surplus that was left over after the purchase of the Tbills? That money is still there, and it’s grown a little. Using the same interest rates we can determine that at the end of 6 months it will have grown to $399.23. What about the value of the bill? We’ll need to know the interest rate for a 6 month bill to know for sure (remember, our 1 year Tbill will essentially be a 6 month Tbill 6 months from now). Currently the interest rate on a 6 month bill is 3.86%. Let’s add 1% to this rate, just as we had done for the money market rate and assume that the going rate for 6 month bills is 4.86% half a year from now. This is a yearly rate, not a semi-annual rate. The semi-annual rate corresponding to a 4.86% yearly rate is 2.4%. So an investor will be able to buy a $10,000 face value 6 month note for $9,765.51 (because $10,000/1.024=$9,765.51). Wait. Didn’t we expect our tbill to fall in value? We bought it for $9,606.15 and it’s now worth $9,765.51 even though interest rates increased dramatically. Why? The answer is that the $10,000 payment is now only 6 months away instead of a full year away. The bill was continuing to do work for us while we held it, even though higher rates are now available on new investments.
Now we can compare the two options. Option 2, our money market only option will have grown to $10,136.53. Option 1, the option where treasury bills were purchased will have grown to $10,164.74 ($9765.51 for the treasury bill + $399.23 residual money market value). Despite the rapid rise in interest rates we’d still be better off buying the treasury bills! We’re not MUCH better off, but we’re still better off. One could conclude that if interest rates were to climb faster than what was used in this example the treasury bill option might be inferior to the money market only option, but that’s a pretty fast rate of increase in interest rates and the penalty for the treasury bill option won’t be very steep.
What’s the moral of the story? The moral is that it can be costly to wait for investments to be offered on more attractive terms before committing to them. It doesn’t matter if the motivation is to make more money or to avoid losing money. Time is our enemy when it comes to sitting on the sidelines. The longer we have to wait for our predictions to come true, the bigger the gap will be between the “safe” option and the “risky” option.
Let’s Now Consider Equities
What does all of this have to do with equities? Yes. Yes they are. But what makes them so different? The differences stem from the fact that equity does not come with the same contractual obligations (Notice I did not say guarantees. Even bonds don’t have guarantees.). When you use your money to buy equity there is no maturity date on which you can expect your principal to be returned to you. An equity is perpetual. You can sell your equity interest to someone else, but you can’t know in advance how far above (or below) your purchase amount the offer will be. Another key difference is that the stream of payments you receive in the form of dividends is not known in advance. Dividend payments are at the discretion of management, and can only be made if cash flow is healthy (which is also unknown). The only certainty is that all equity owners will receive the same dividend payment per share of stock.
These uncertainties are what lead investors to demand what is called an “equity risk premium”. This premium is the annual return investors expect to receive relative to a known benchmark rate of return. Common estimates of the equity risk premium based upon past data is that equity provides an annual rate of return of 2-4% per year more than 10 year treasury notes. So if a 10 year US Treasury Note yields 1.5%, one might fairly assume that US equities will be priced such that the forward 10 year return on stocks is 4.5%. And what if the 10 year treasury yield climbs from 1.5% to 3.5%? Then one might expect stock prices to adjust in such a way (hint: they go down) so that the future expected 10 year return is 6.5%. There are many other factors involved. But in general we can expect that interest rates will have an impact on stock prices.
So now we get to the part where we can draw an analogy. In the emergency fund example we compared a money market to a very short term bond. It was shown that an investor could seek to avoid uncertainty, but that choice would come at a cost. The longer the investor waits on the sidelines for an adverse event to take place, the bigger the adverse event needs to be to overcome the cost of waiting.
It’s the same with the decision of whether or not to have equity exposure. A person can sit on the sidelines for the bear market he/she thinks is inevitable. But the longer that person waits to invest, the longer the corporations are earning profits, reinvesting profits for growth, and paying excess profits out to shareholders. The big difference in the case of equities is that there is no approaching maturity date. The analysis requires more assumptions and guess work; nevertheless, one conclusion that can be reached is the longer a person waits on the sidelines the higher the opportunity cost will be.
An example will suffice to make the point. The Vanguard High Yield Index fund is a fund (VHYAX) I use in my own portfolio for the purposes of generating an income stream (this is not a recommendation for what you should do, only an example). The dividend yield based upon the past 4 quarters is 3.2%. What will be the nominal growth rate of those dividends? I don’t know. From the beginning of 2008 to now the annual growth rate was about 6%. Let’s be conservative and assume a growth rate of 3.3%. I’m choosing 3.3% because a 3.2% dividend yield + a 3.3% growth rate gives an expected long term return of 6.5%, which is a 3% equity risk premium above the current 10 year treasury note yield of 3.5%. I personally think the rate of nominal growth will be higher, but for the sake of this example I will err on the side of conservatism.
If instead of spending the dividends they are reinvested and the dividend yield remains constant we can easily calculate the terminal value of a $10,000 investment after a certain number of years. After 1 year it will be $10,650. After 2 years it will be $11,342. After 3 it will be $12,079. And so on.
But the big risk is the value of the fund when we decide to sell. Just as is the case with selling a bond on the secondary market, when we sell shares of a stock or a mutual fund the price someone will be willing to pay will be influenced heavily by the rate of return that can be generated by competing investments. Even though the yield available from VHYAX is 3.2% now, maybe someone will demand a yield of 4%, 5%, or even 6% in the future. This can certainly happen if interest rates continue to climb and bonds become more attractive. It’s not too difficult to adjust the final nominal value for changes in dividend yield. All one needs to do is multiply by the ratio of the current yield to the terminal yield. This is a simplification. In reality the final value will be determined by the path the dividend yield takes on its journey from its current value to its terminal value. This is because as dividend yields rise the dividends can be reinvested at ever more attractive rates. Since it’s impossible to do an analysis for every possible trajectory, we’ll just simplify and make an adjustment at the very end, as if a sudden change in yield occurs.
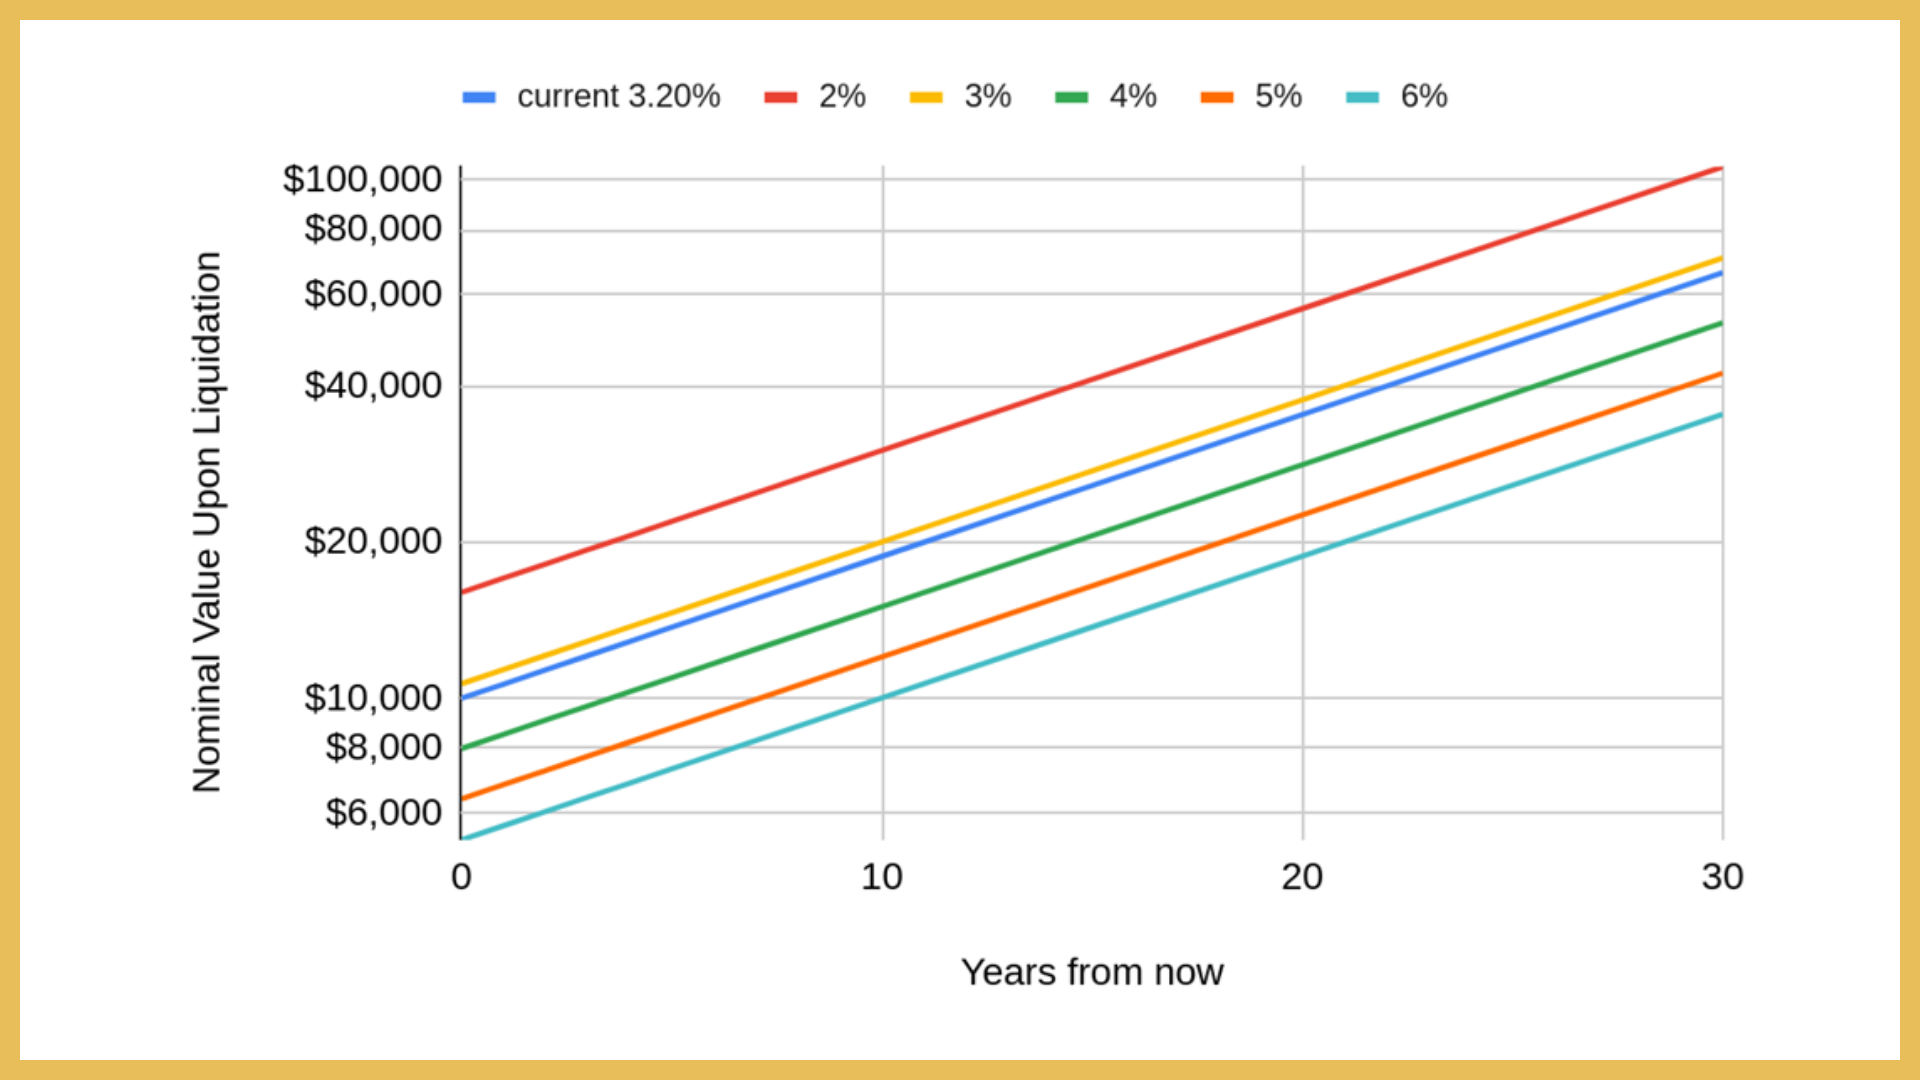
The worst case outcome is if the dividend yield rises to 6%. This is representative of a near 50% change in valuation. If such a change were to occur immediately after purchase then a $10,000 investment would suddenly be worth only $5,333. Bummer. What if such an event didn’t take place until year 10? In that case the nominal value would be $10,011, nearly breakeven. By contrast, a 10 year treasury note bought today yielding 3.5% interest will be worth $14,106 in 10 years if all of the interest can be reinvested at the same rate (which can be achieved by buying 10 year treasury zeros by the way). So if the dividend yield drops to 6% an investor certainly would be better off having bought a 10 year treasury note.
But what if the dividend yield doesn’t change? In that case the $10,000 investment in VHYAX will be worth $18,771 in 10 years. How far would the dividend yield need to climb before an investment in VHYAX will perform similarly to a 10 year note? It turns out the answer is 4.25%. Will this happen? It could. The trailing 4 quarter dividend yield reached 5.5% at the depths of the 2008/2009 financial crisis. But even if this happens again the nominal value of a $10,000 investment would still be nearly $11,000 10 years from now, certainly an outcome that is not as good as a 10 year note, but not a nominal loss either.
But what about a longer time horizon? Many of us, even some who are already retired, have an investment horizon greater than 20 years (especially if you care to leave a legacy to your heirs). Even if the dividend yield climbs to 6%, and ignoring more favorable dividend reinvestment, the nominal value of a $10,000 investment in VHYAX in 20 years will be $18,800, which is a 3.2% nominal rate of return. In 25 years it will be $25,748, a 3.9% nominal rate of return. And in 30 years it will be $35,277, a 4.3% nominal rate of return. The longer a person is able to stay invested, the less important the terminal valuation becomes.
A person can still fret over the worst case scenario and remain on the sidelines waiting to invest. But remember, every year on the sidelines is a year where the corporations you could have owned are generating profits, reinvesting them for growth, and distributing them via dividends. What if you wait for 10 years and your fears are not realized? The status quo case would have $10,000 invested in VHYAX grow to $18,771. Compared to a 10 year treasury note, which will grow to $14,106. That’s a $4,665 difference, which is a lot of nice dinners out!
The future is unknown and it is unknowable. Equities could certainly continue to decline in price as they have for the past 8 months. Staying out of equities until the smoke clears may turn out to be the wisest course of action. The future may turn out to be as bleak as it looks. On the other hand, one might consider the experiences of those who lived through the past 120 years and how bleak the future must have looked to them. I like to think the record of the past suggests maintaining an optimistic stance with the majority of one’s portfolio in equities. After all, we’ve been through a lot and gotten to the other side. There is a cost of waiting to invest, and that cost has tended to grow the longer a person remains pessimistic.