Oh, so much is being made out of the release of the Fed minutes from their last meeting. How will they “taper”? Will they raise rates in March? By how much? What will be the impact on stock prices? How about gold? Could this be the pin that pricks the “everything bubble”? How should we play this? Is now the time to go to an all-cash position?
Personally, I think we do ourselves a disservice by focusing on such things. Short-term movements in asset prices (I’m thinking specifically about stocks and gold) are largely random. Sometimes prices behave in a way that seems to fly in the face of how they “should” react in response to current events. Should gold have dropped from its high of about $1900 to $1050 from 2011 to the end of 2015 when the Federal Reserve was flooding the world with money? How about its drop from mid-2020 to the present in the face of the same Federal Reserve action? Why should the S&P500 have rallied to new highs in the face of the economic effects of the response to the pandemic that started in early 2000? Why would the S&P climb relentlessly higher in the late 1990s despite the Federal Reserve chair at the time voicing his opinion that prices were too high? The answer is that in the short term prices are more a reflection of psychology than anything else, and psychology is very difficult to predict because it can turn on a dime (perhaps this is the reason the Federal Reserve seems to be so active at managing perceptions). Longer-term the behavior of assets is more predictable, and I think I’ve done a good job of showing this.
Given this short-term uncertainty, a logical question arises: “how much of my portfolio should I keep in cash?” This is an excellent question and one that can be informed by some mathematical evaluation. I say “informed” because mathematical models cannot precisely predict the future. They can, however, help guide our decision-making. Today I am going to discuss how I view the cash vs. stocks decision. I’m going to leave out the discussion of gold (for now). The benefit of this article to you should be to give you some ideas of a general framework you can use to shape your own decision-making. If I receive requests in the comments section to do so I will extend this analysis to include gold.
Stocks currently sport fairly high valuations. I have not encountered too many individuals who would argue this fact. Yet people still hold equities. Why is this? Aside from the obvious argument that “someone has to”, what it comes down to is that millions of investors are deciding they have a preference to hold equities over cash. Let’s take a look at US Value stocks using Vanguard’s Value Index (VVIAX) as a proxy.

Figure 1: VVIAX Inflation-Adjusted Total Real Value (dividends reinvested) from 2001 to the Present
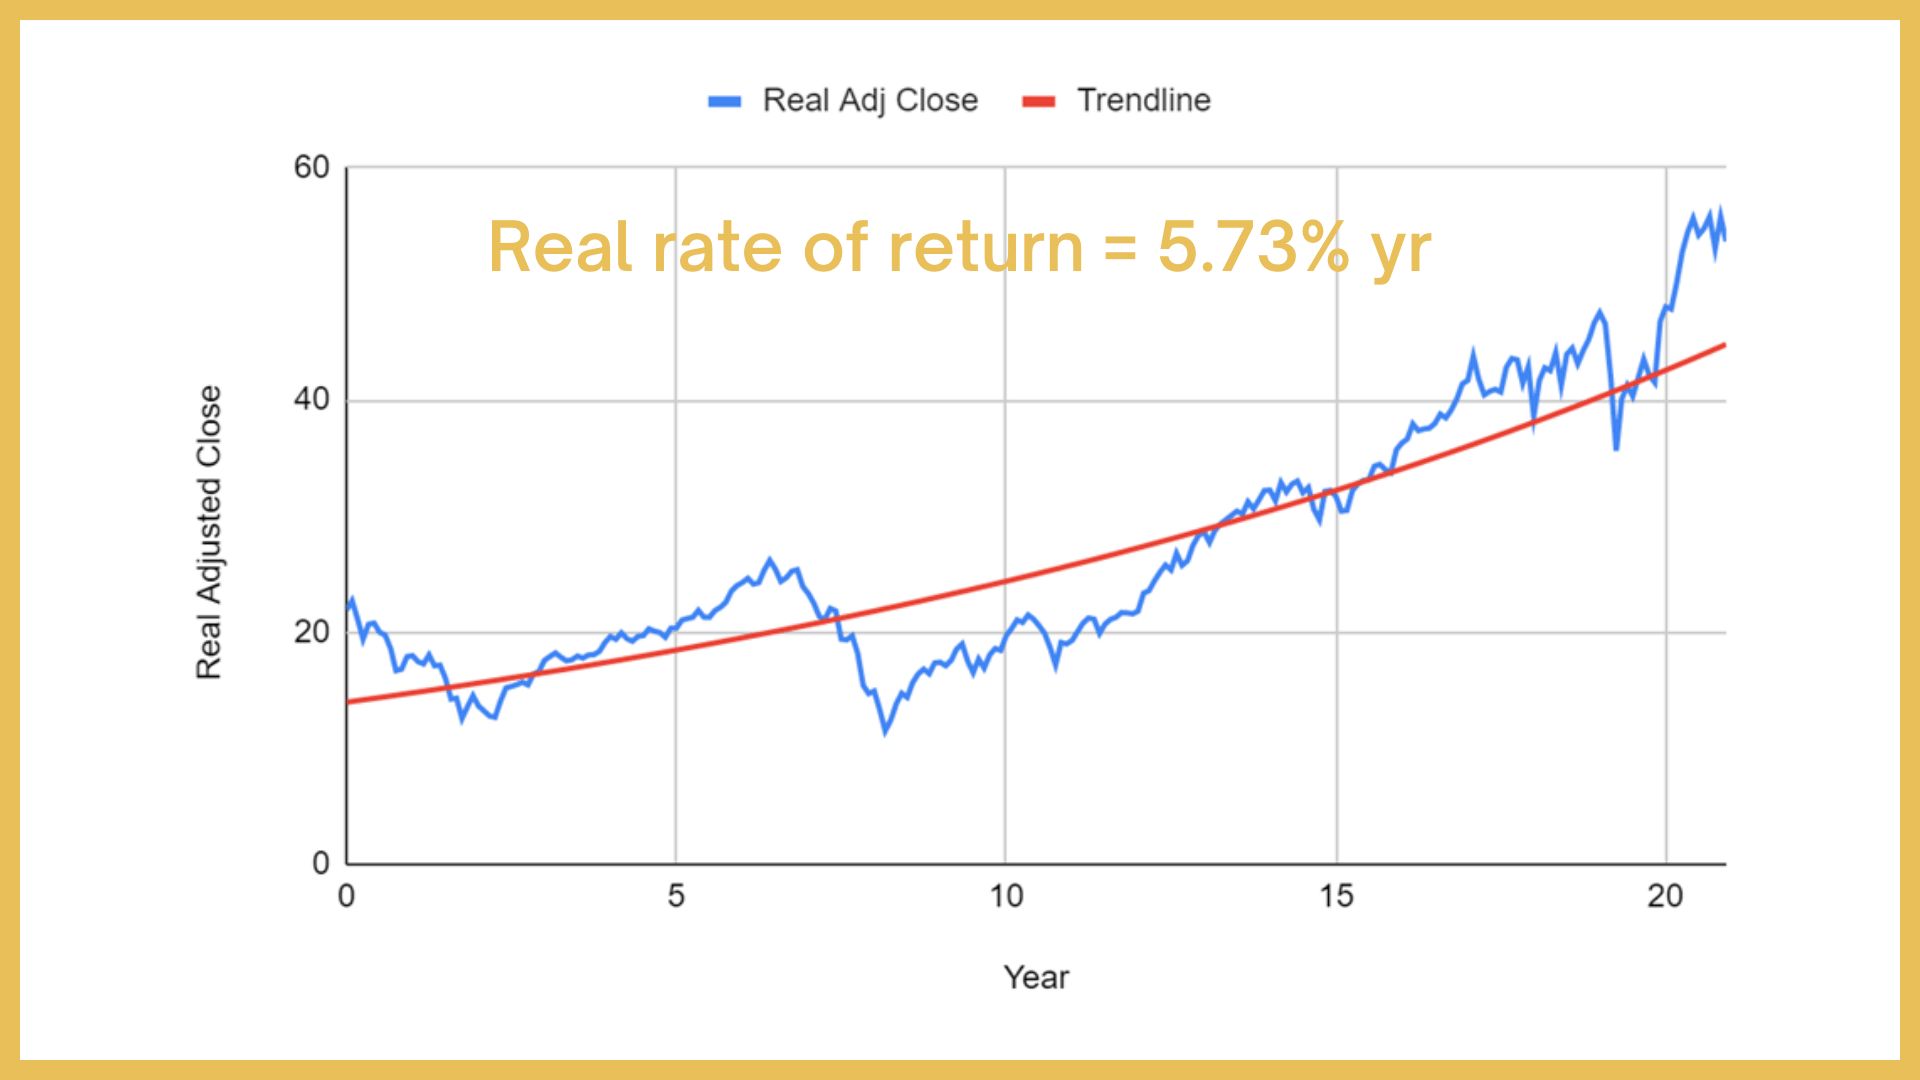
Figure 2: VVIAX Inflation-Adjusted Total Real Value (dividends reinvested) from 2001 to the Present
Figures 1 and 2 show the real inflation-adjusted value of a person’s wealth invested in VVIAX from December 2000 through the end of 2021. This wealth is calculated by assuming the investor reinvested dividends and it is adjusted based upon the consumer price index (CPI) reported by the Bureau of Labor Statistics. The scale is set so that the rightmost point is the current price of VVIAX ($58). The first chart is presented on a logarithmic chart. The rate of real wealth accumulation generated by VVIAX has been 5.73% per year, though that is not the experience of all investors. Depending upon when a person bought or sold they could have a completely different result. Timing is everything (for the short-term investor). As short-term psychological factors of fear and greed drove prices to oscillate, the long-term effects of business growth and dividend reinvestment drove the relative highs and lows relentlessly higher. The longer-term oriented investor was much more likely to see a return approaching the 5.73% per year level than the short-term oriented investor.
Right now we can see that the adjusted close value of VVIAX is significantly above its trendline, indicating that value stocks are pricey relative to their 20-year average (again, I feel it is necessary to clarify that the adjusted close is based upon dividend reinvestment and CPI adjustment). How pricey are they? We can compare my chosen proxy against prior extremes. In Figure 3 I present a histogram showing the frequency of deviations of specific magnitudes from the trend. The deviations are the value of inflation-adjusted wealth divided by the value of the trendline.
Currently, the ratio of the value of VVIAX to the trendline is 1.28. I labeled this on the chart. Yes, this is more pricey than the majority of the data; however, it is less so than prior extremes. In May of 2007, the ratio stood at 1.31. In January of 2001, the ratio stood at 1.62. I dare say the ratio was probably even more extended in early 2000 at the peak of the 90’s stock market boom, but the data for VVIAX does not extend that far back.

Figure 3: Histogram of Deviations from the 20 Year Trendline
How did those who were invested in May of 2007 and January of 2001 fair? It depends on how long they were able to hold on. Notice from Figures 1 and 2 that the investor who plowed a bunch of money into value stocks in January 2001 and May 2007 lost quite a bit of wealth if they only held for a couple of years; however, those who were able to avoid liquidating their investments and held on until today enjoyed gains in their wealth. They just needed three things: 1) a long-term perspective, 2) not needing the cash to fund expenses, and 3) nerves of steel. Those who chose to remain invested, even at these high starting levels, were bailed out by the relentless march upward of the trendline due to business growth and dividend reinvestment.
The question of how much cash is wise to hold (again, ignoring gold for now) is largely a question of when cash is likely to be needed. It’s not as simple as saying “well, stocks appear to be high relative to the past and so I’m just going to wait in cash”. Someone who did that would have missed the returns from October 2003-May 2007 and from May 2016-December 2019 when valuations continued to remain above those of the past. Of course one could argue that staying in cash also would have resulted in avoidance of the 2007-2009 and early 2020 bear markets; however, there’s really no clear way of determining the right time to re-enter the market. Nobody, for example, could have predicted that the bear market of early 2020 would have been as short as it turned out to be in hindsight. What we can do is establish probabilities of our future results based upon observations from the past and then fashion our investment decisions accordingly. We can do this by assuming that at any point in the future the deviation of actual results relative to the trendline might be similar to what we have seen in the past. Obviously, such an approach ignores the possibility that the future might be completely different from the past, but it at least serves as a reasonable starting point for informing decisions.
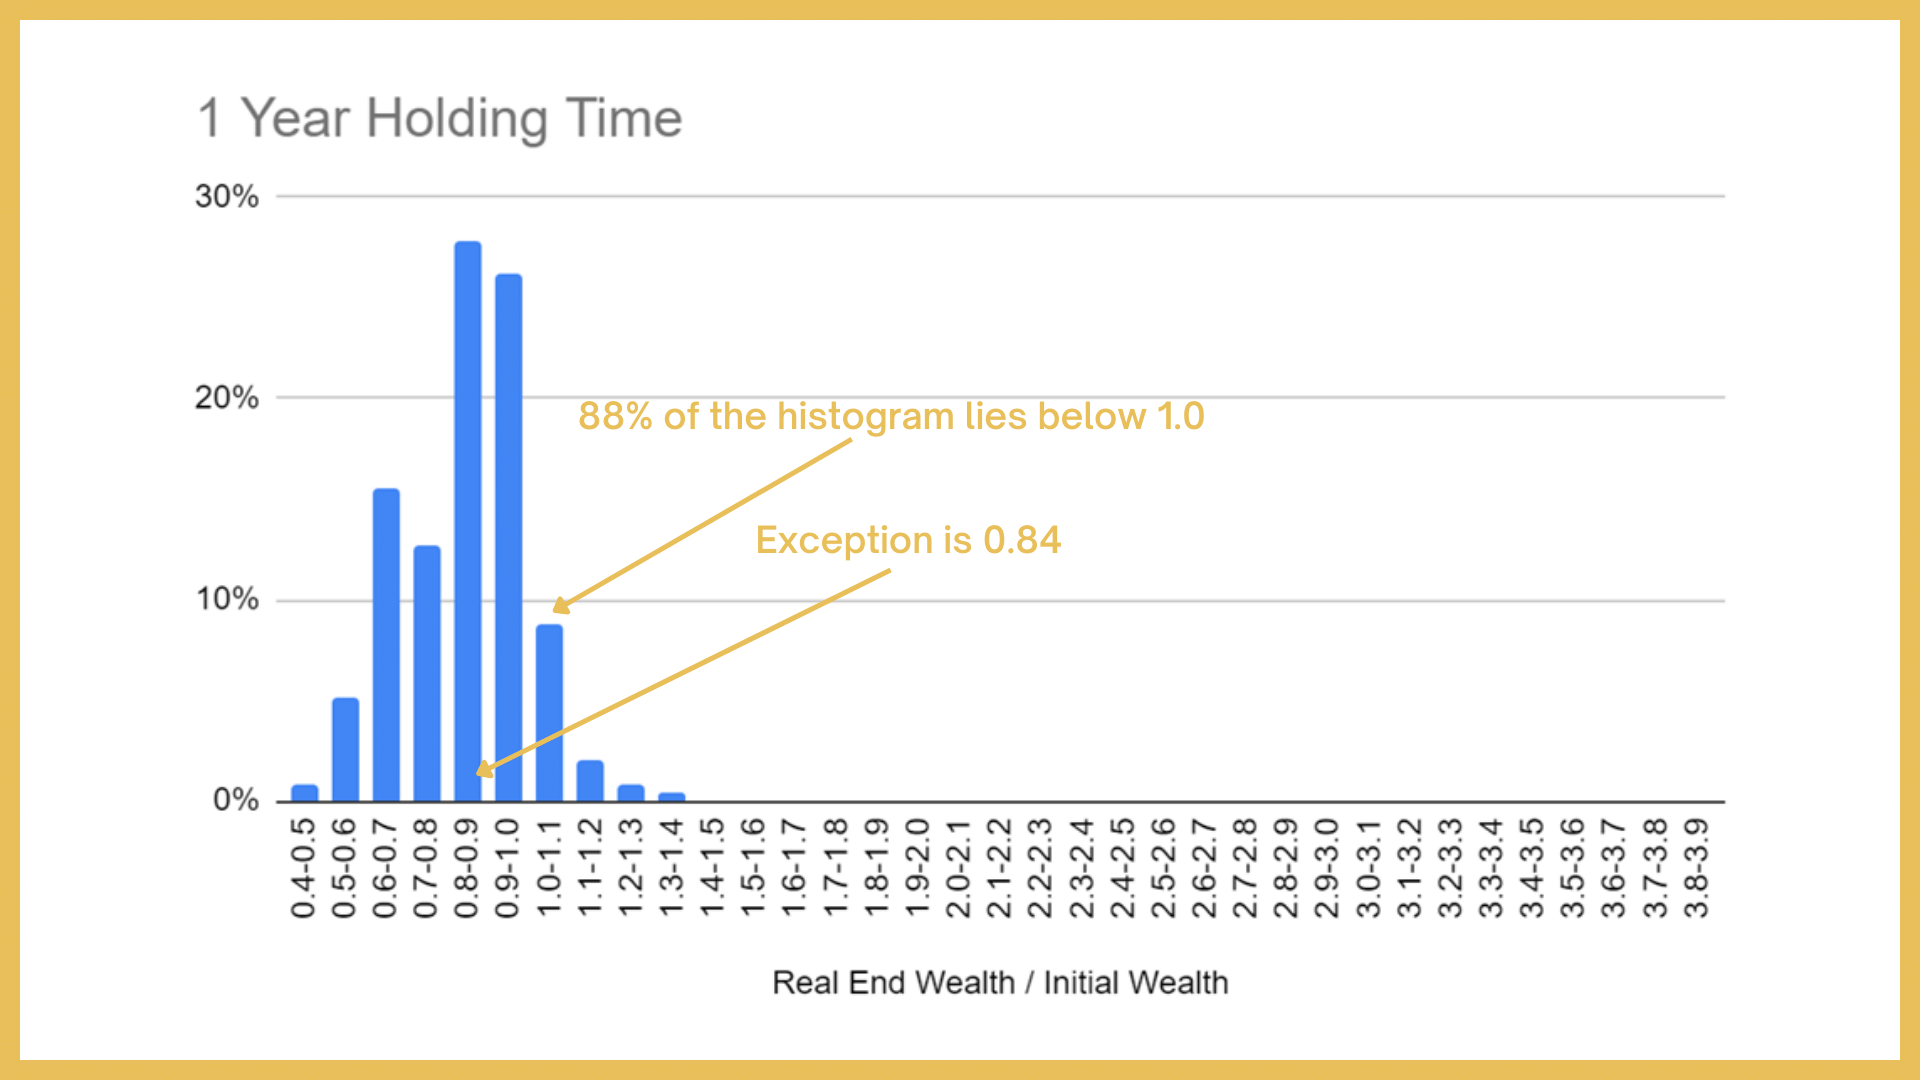
Figure 4: Histogram of Possible 1 Year Returns from Today’s Valuation
If we assume that 1 year from now VVIAX valuations can assume any of the values we have seen in the past and weight each of these values by their frequency of occurrence we can envision what the upcoming year might deliver to holders of VVIAX. Figure 3 presents this information as a histogram. The X-axis represents the ratio of real wealth 1 year from now vs. real wealth held in VVIAX today. Each bar represents a range spanning 10%. The height of each bar is the likelihood of the return from today’s valuation. Notice that most of this histogram resides below 1.0, meaning that if one goes solely based upon past valuations it is more likely than not that a person will lose wealth holding VVIAX. 88% likely as a matter of fact. So why on Earth would anyone want to hold these stocks? Well, for one there is still a 12% chance that a person’s net worth will increase by holding them over the coming year. For another, there have been periods of time in the past where valuations remained stubbornly high. And finally, if stocks are competing against cash we have to acknowledge that the real rate of return on cash is a few percentage points to the negative, meaning that it is nearly certain that a person holding cash will lose purchasing power.
What do the prospects look like for a longer-term holder? Applying the same assumptions we can assign probabilities to various outcomes. Figures 5-8 show these possible outcomes for holding periods of 3, 5, 10, and 20 years. I’ve placed all of these histograms on the same scale to demonstrate two features. First, over time the histogram moves to the right. This is a result of business growth and reinvested dividends gradually increasing a person’s chances of building wealth. This should not come as much of a surprise to anyone. Second, notice that the histogram width tends to grow in size. So although the odds of growing wealth increase with time the range of outcomes also grows. This makes long-term planning very difficult which is one of the reasons I advocate mixing some gold into a portfolio of stocks to improve the consistency of returns (a subject I cover in my book).
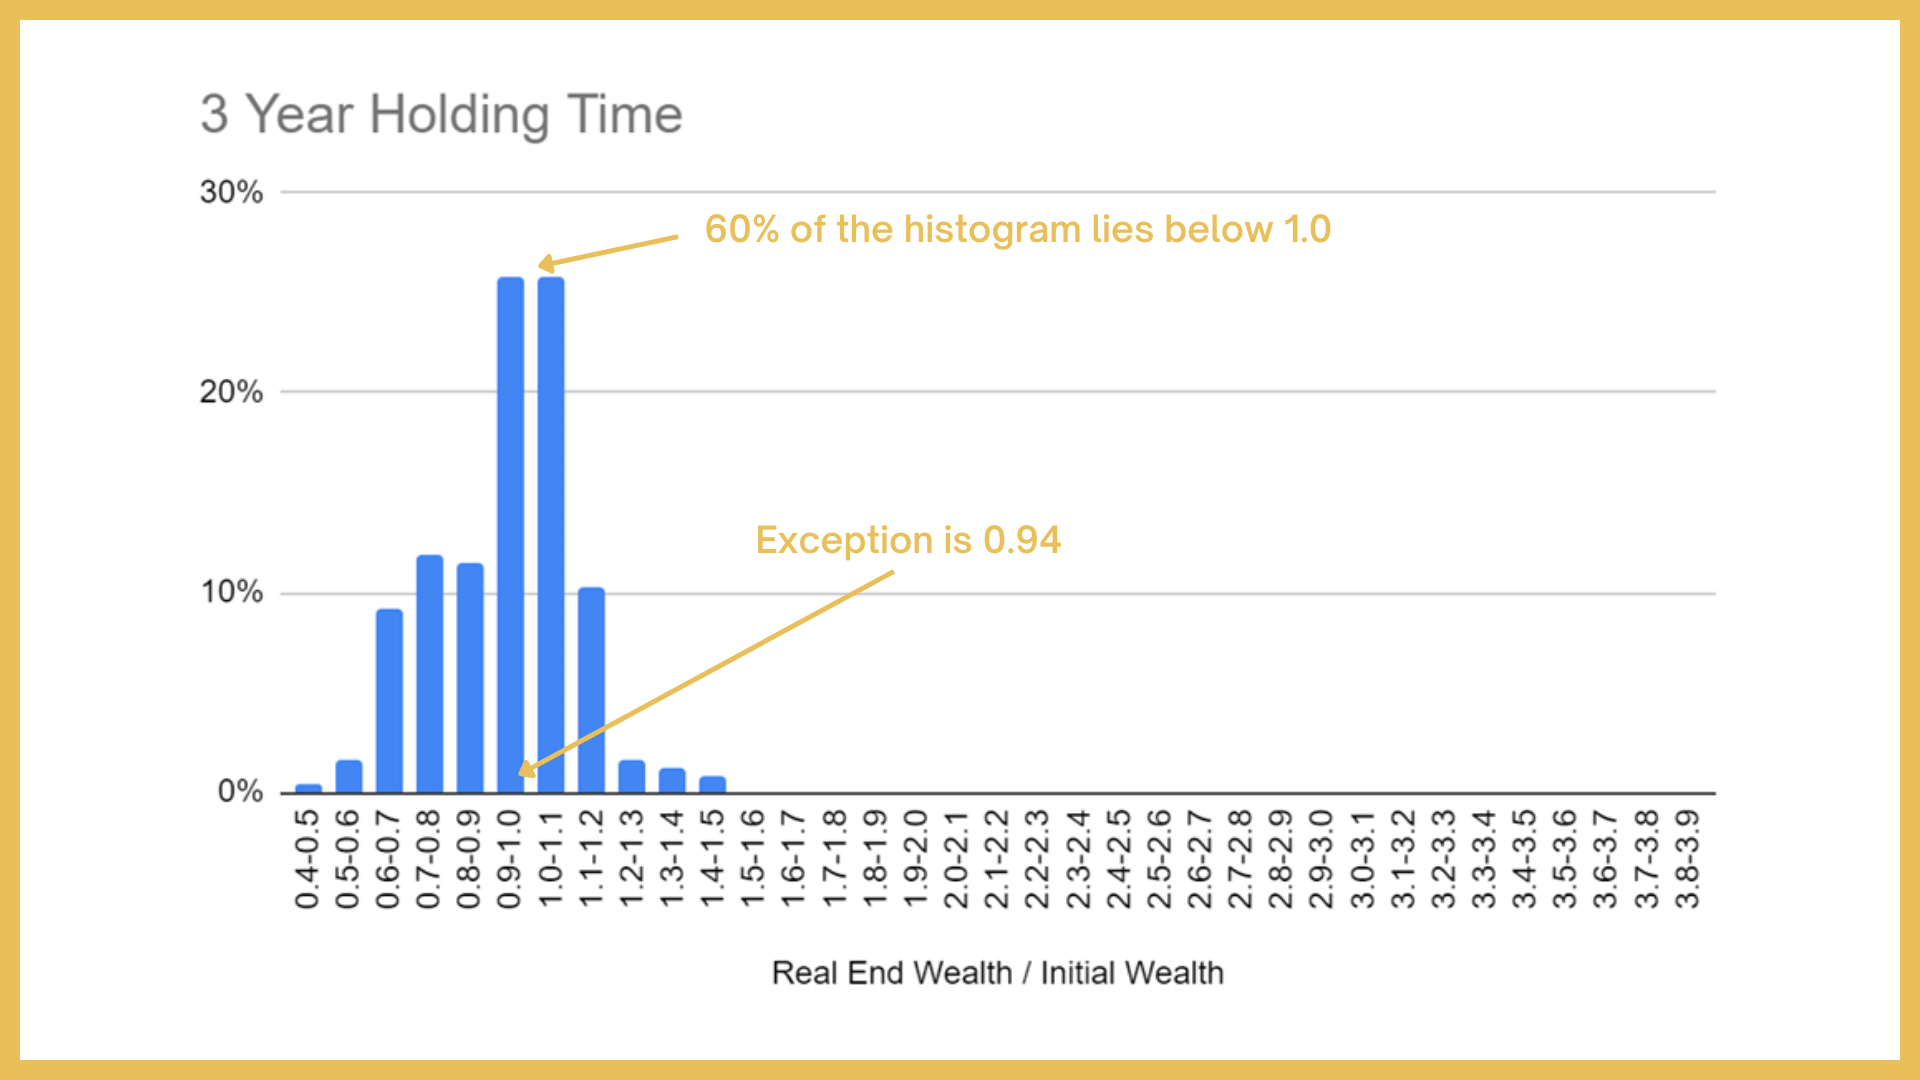
Figure 5: Histogram of Possible 3 Year Returns from Today’s Valuation
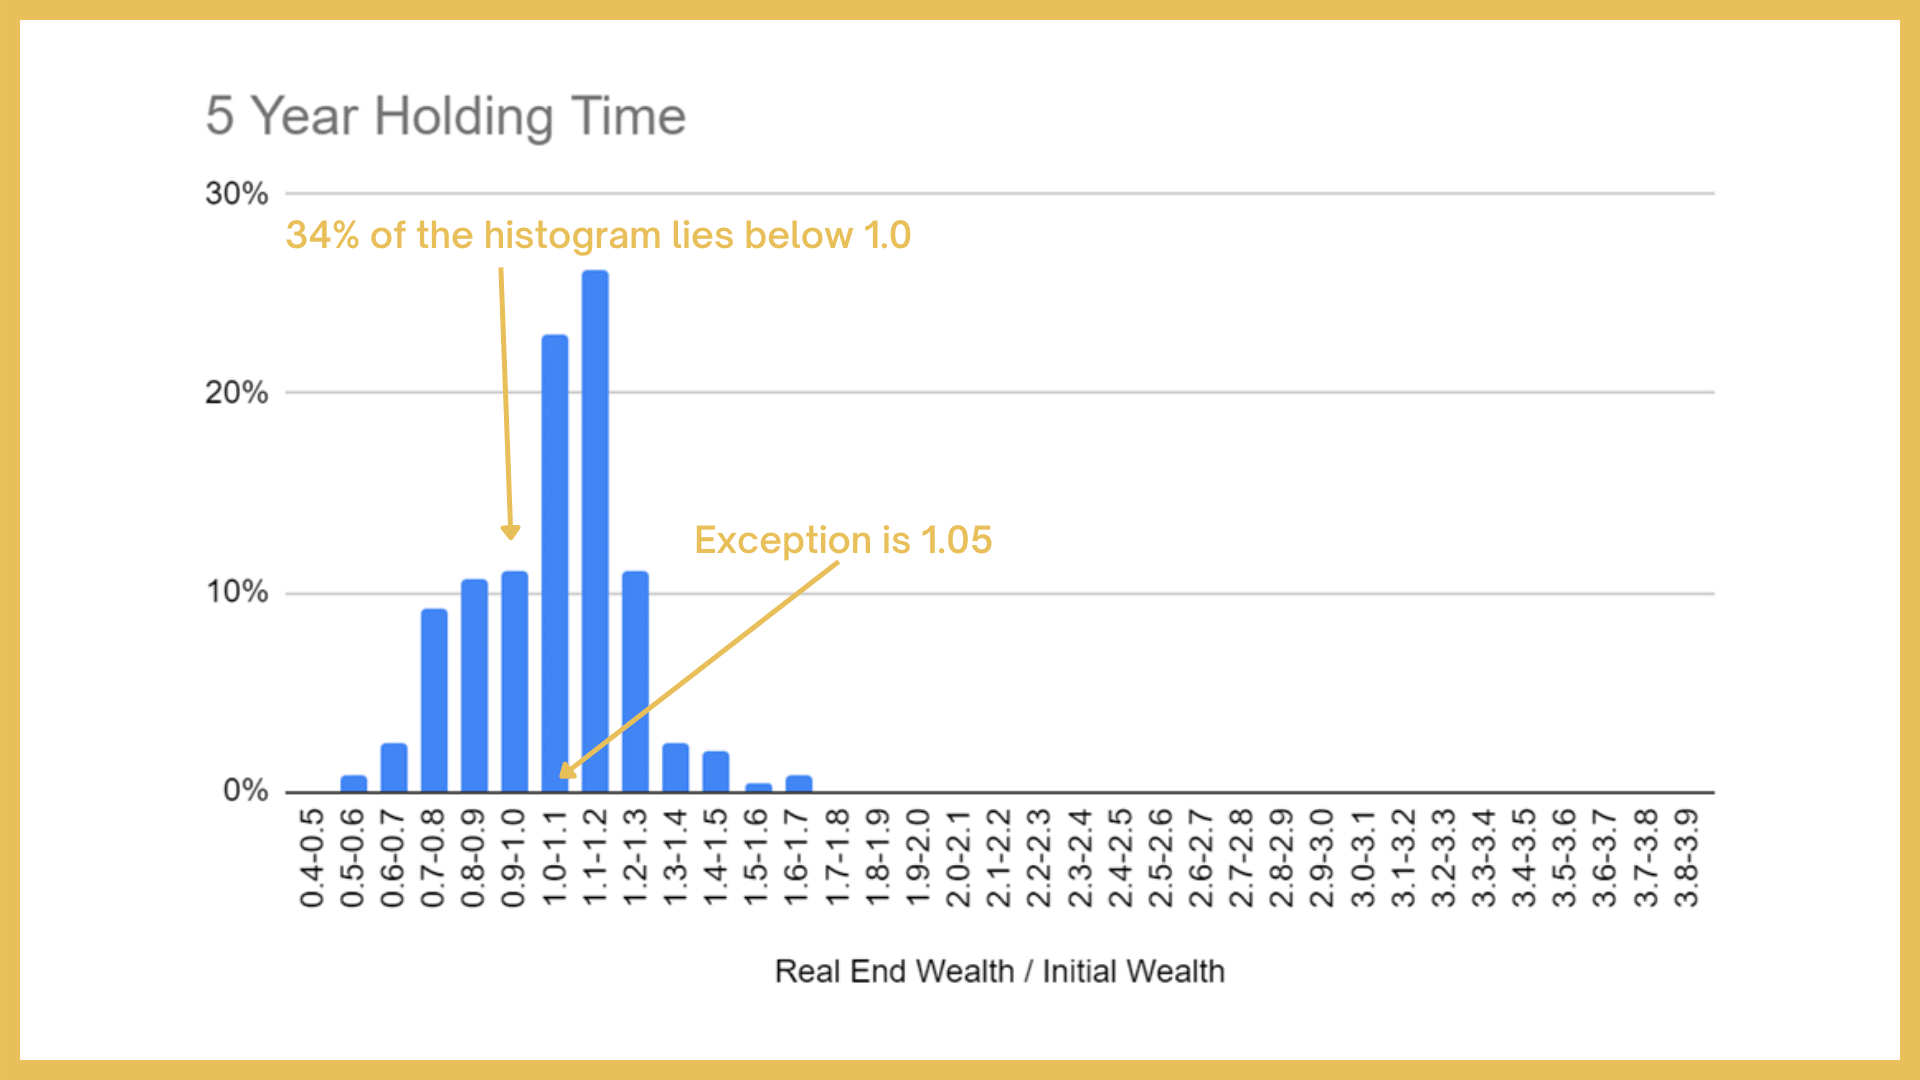
Figure 6: Histogram of Possible 5 Year Returns from Today’s Valuation
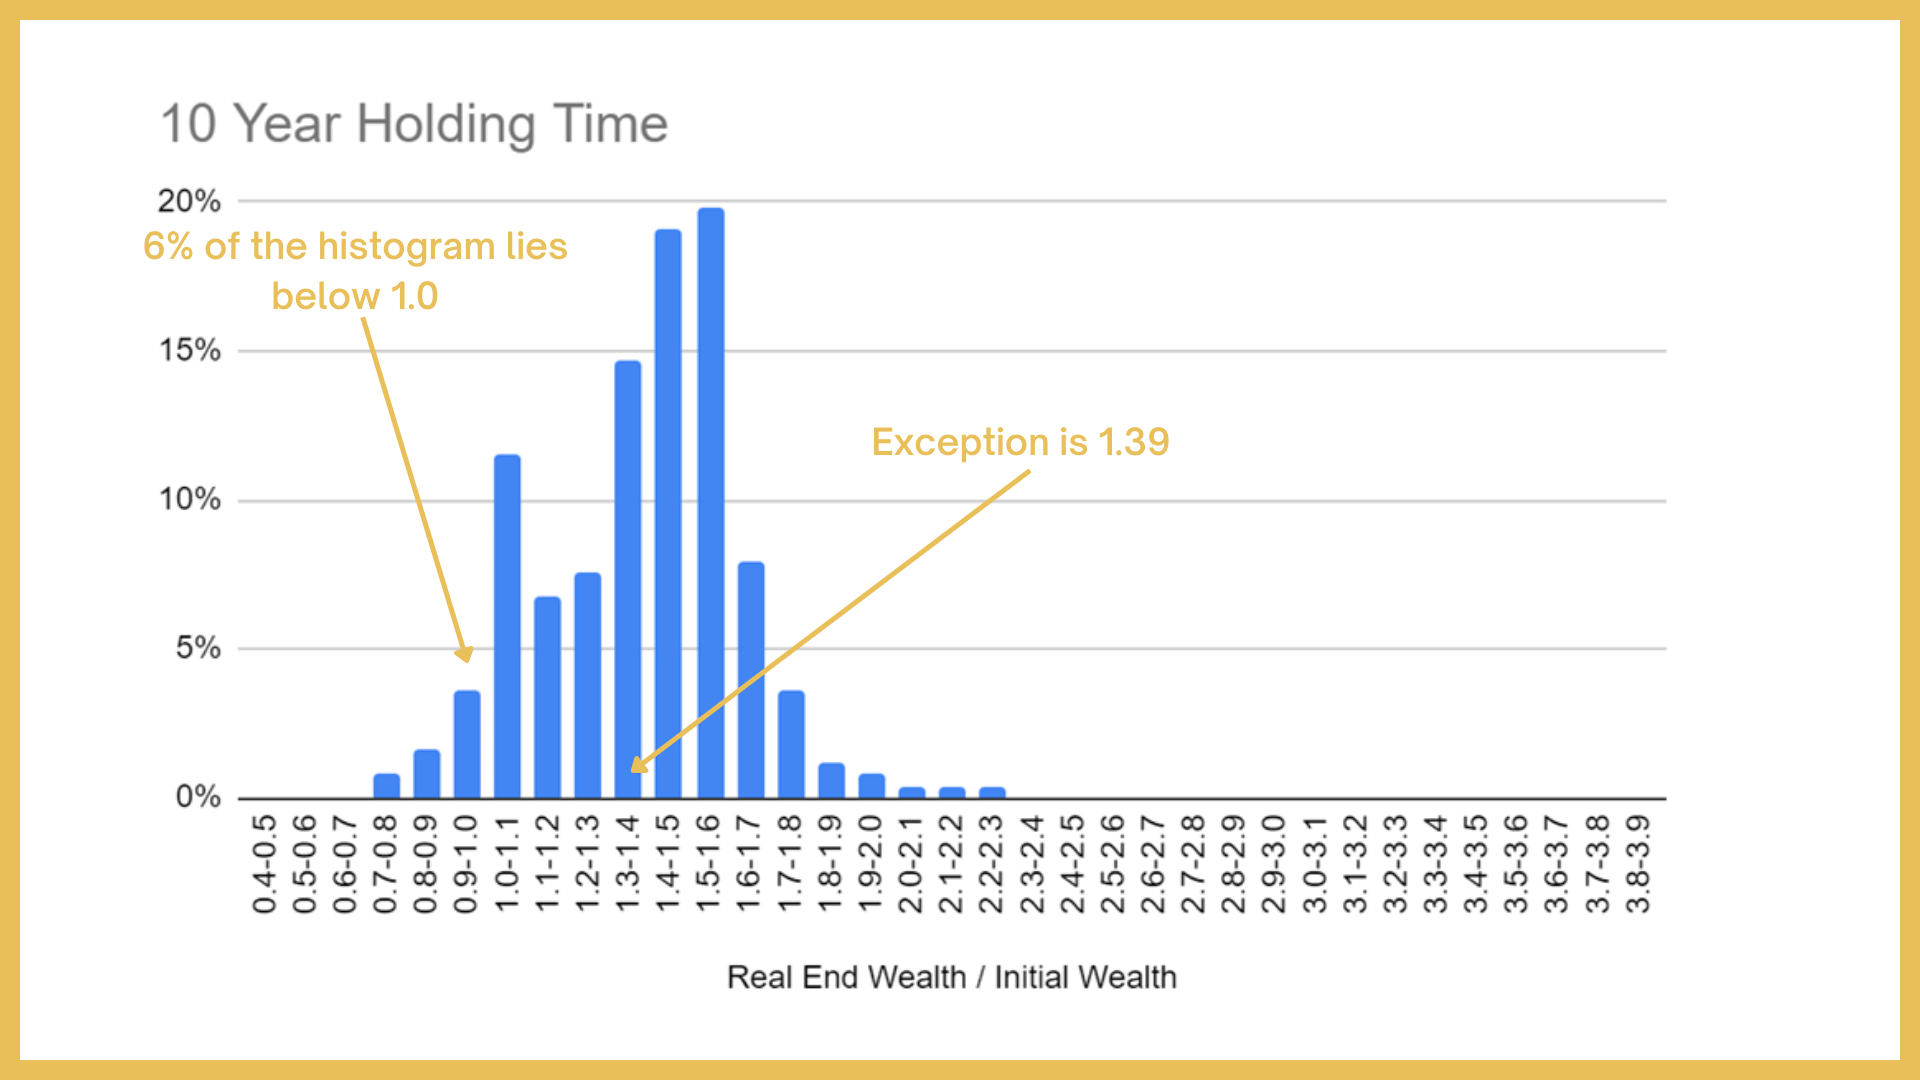
Figure 7: Histogram of Possible 10 Year Returns from Today’s Valuation
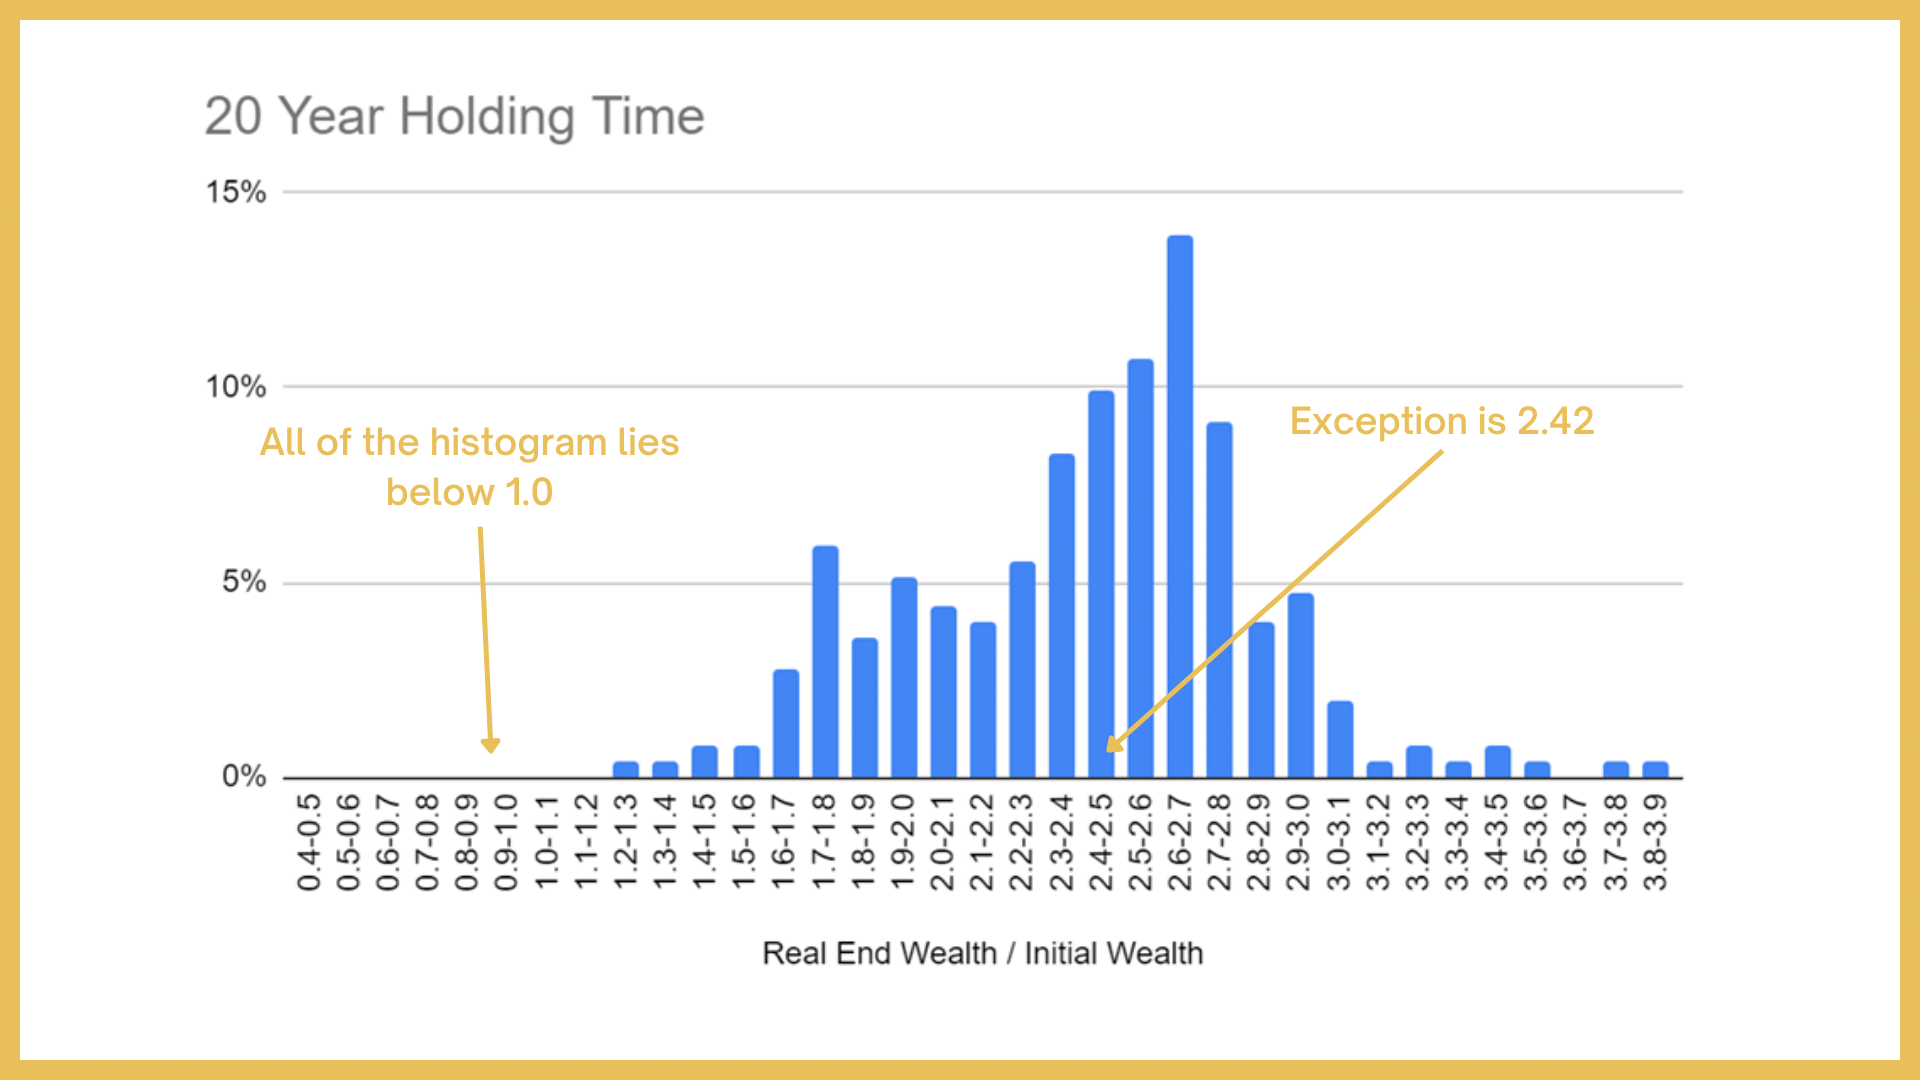
Figure 8: Histogram of Possible 20 Year Returns from Today’s Valuation
Over time the certainty of building wealth in equities improves with time. For a 1 year holding period, using today’s valuation as a starting point, there is an 88% chance of losing wealth over the coming year. For a 3 year holding period, there is a 60% chance of losing wealth. For 5 years the odds of losing wealth drop to 34%. In other words, starting with current valuations and holding for 5 years the odds of building wealth in stocks are better than the odds of losing. Once we get to 10 years the odds of losing real wealth are 6%. At 20 years the odds are well under 1%. Figure 9 shows this graphically.
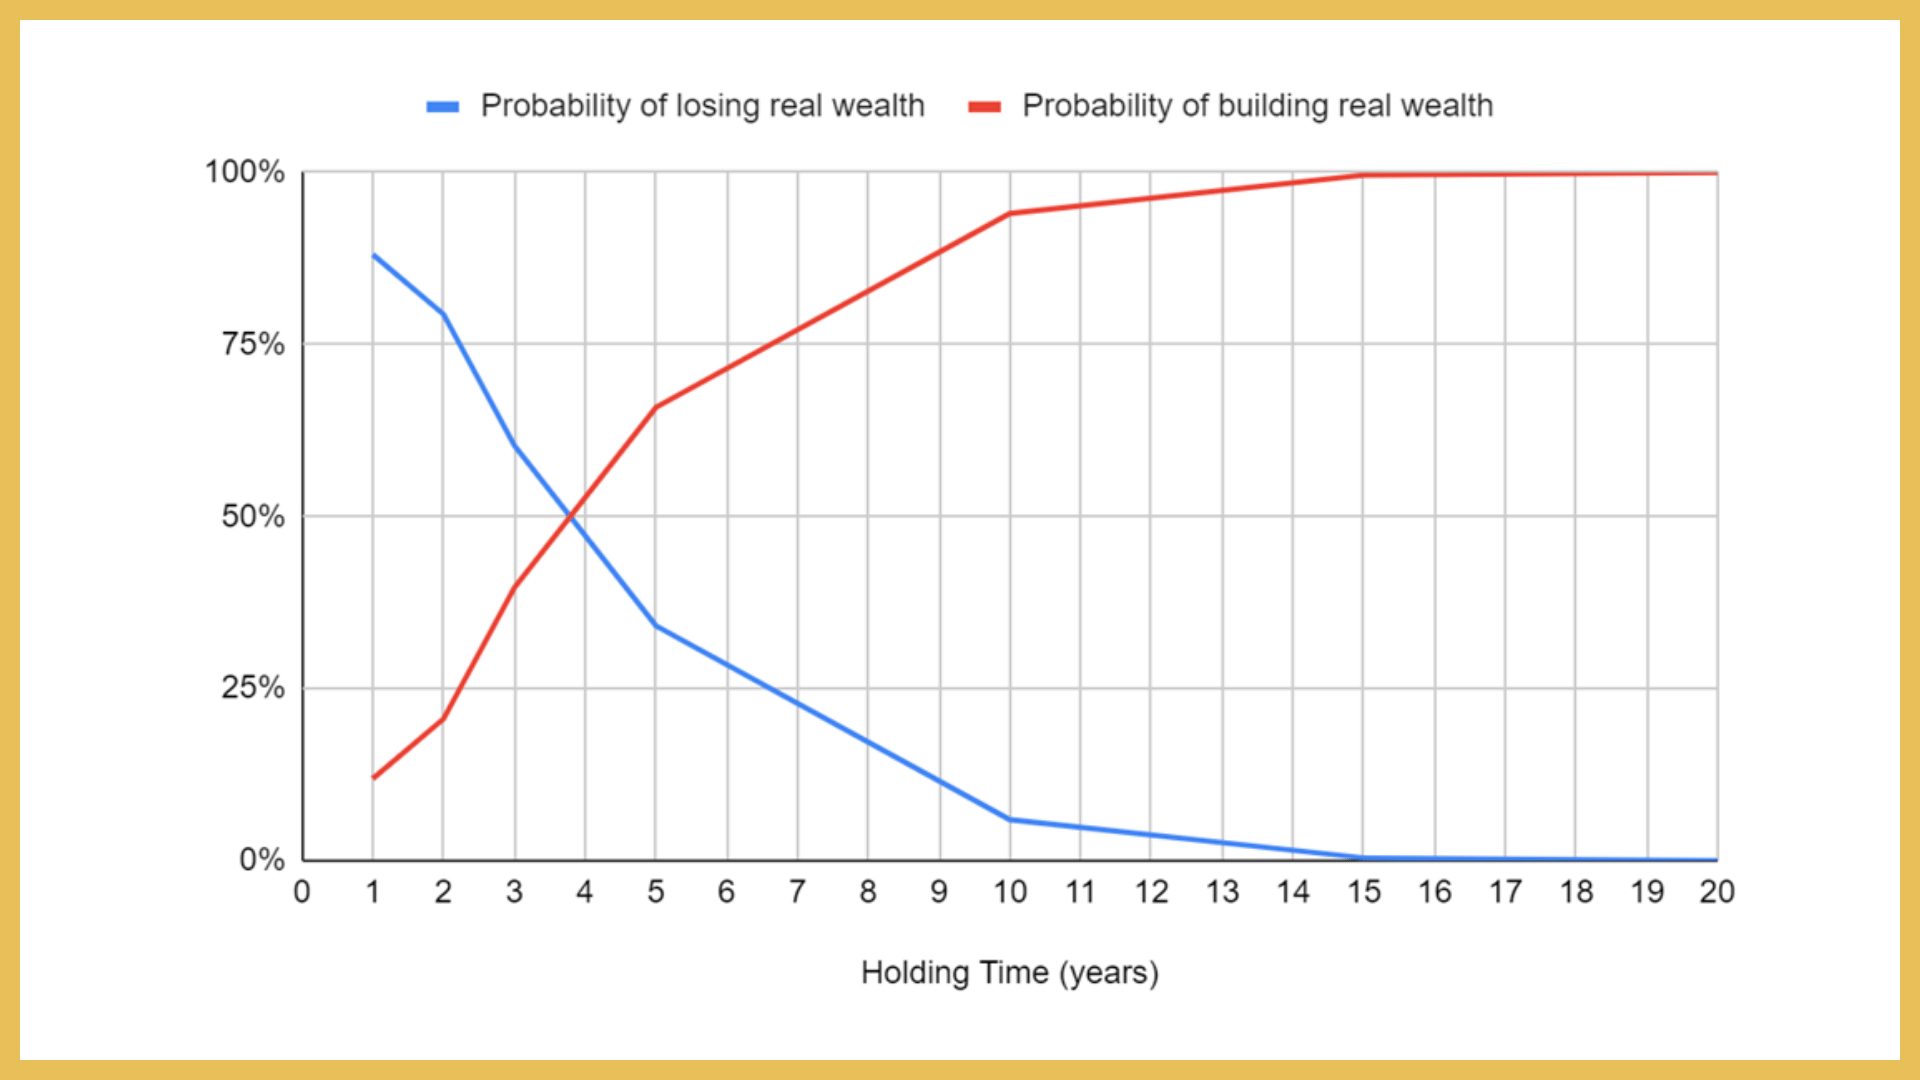
Figure 9: Probability of Building Wealth vs. Losing Wealth for Various VVIAX Holding Periods
If the odds of losing wealth in stocks is better than building wealth for holding periods of less than 4 years then why would anyone want to hold stocks instead of just holding cash? Need I remind you that cash-like investments are not paying any meaningful interest nowadays? Cash has lost purchasing power for at least a decade now, and all signs point to interest rate suppression continuing (unless, of course, you believe that the Fed minutes are more than just jawboning). The price of admission for long-term gains is a willingness to withstand a short-term loss of purchasing power. Notice in Figures 4-8 I included the expected gain for each holding period (this is the center of gravity of the histogram). For holding periods of 10 years or more one can fairly expect to increase one’s wealth by 40% or more. This is not the case with cash. But one must be willing to withstand the pain of a short-term loss to get there.
The last graph I would like to present is Figure 10. This shows the expected wealth of a stock holding vs. the expected wealth of a cash holding over time horizons of 1-20 years. I assumed real interest rates are maintained at about -2% for cash-like investments. You can assume whatever rate you like, but I wouldn’t recommend going too much higher than 0% anytime soon.
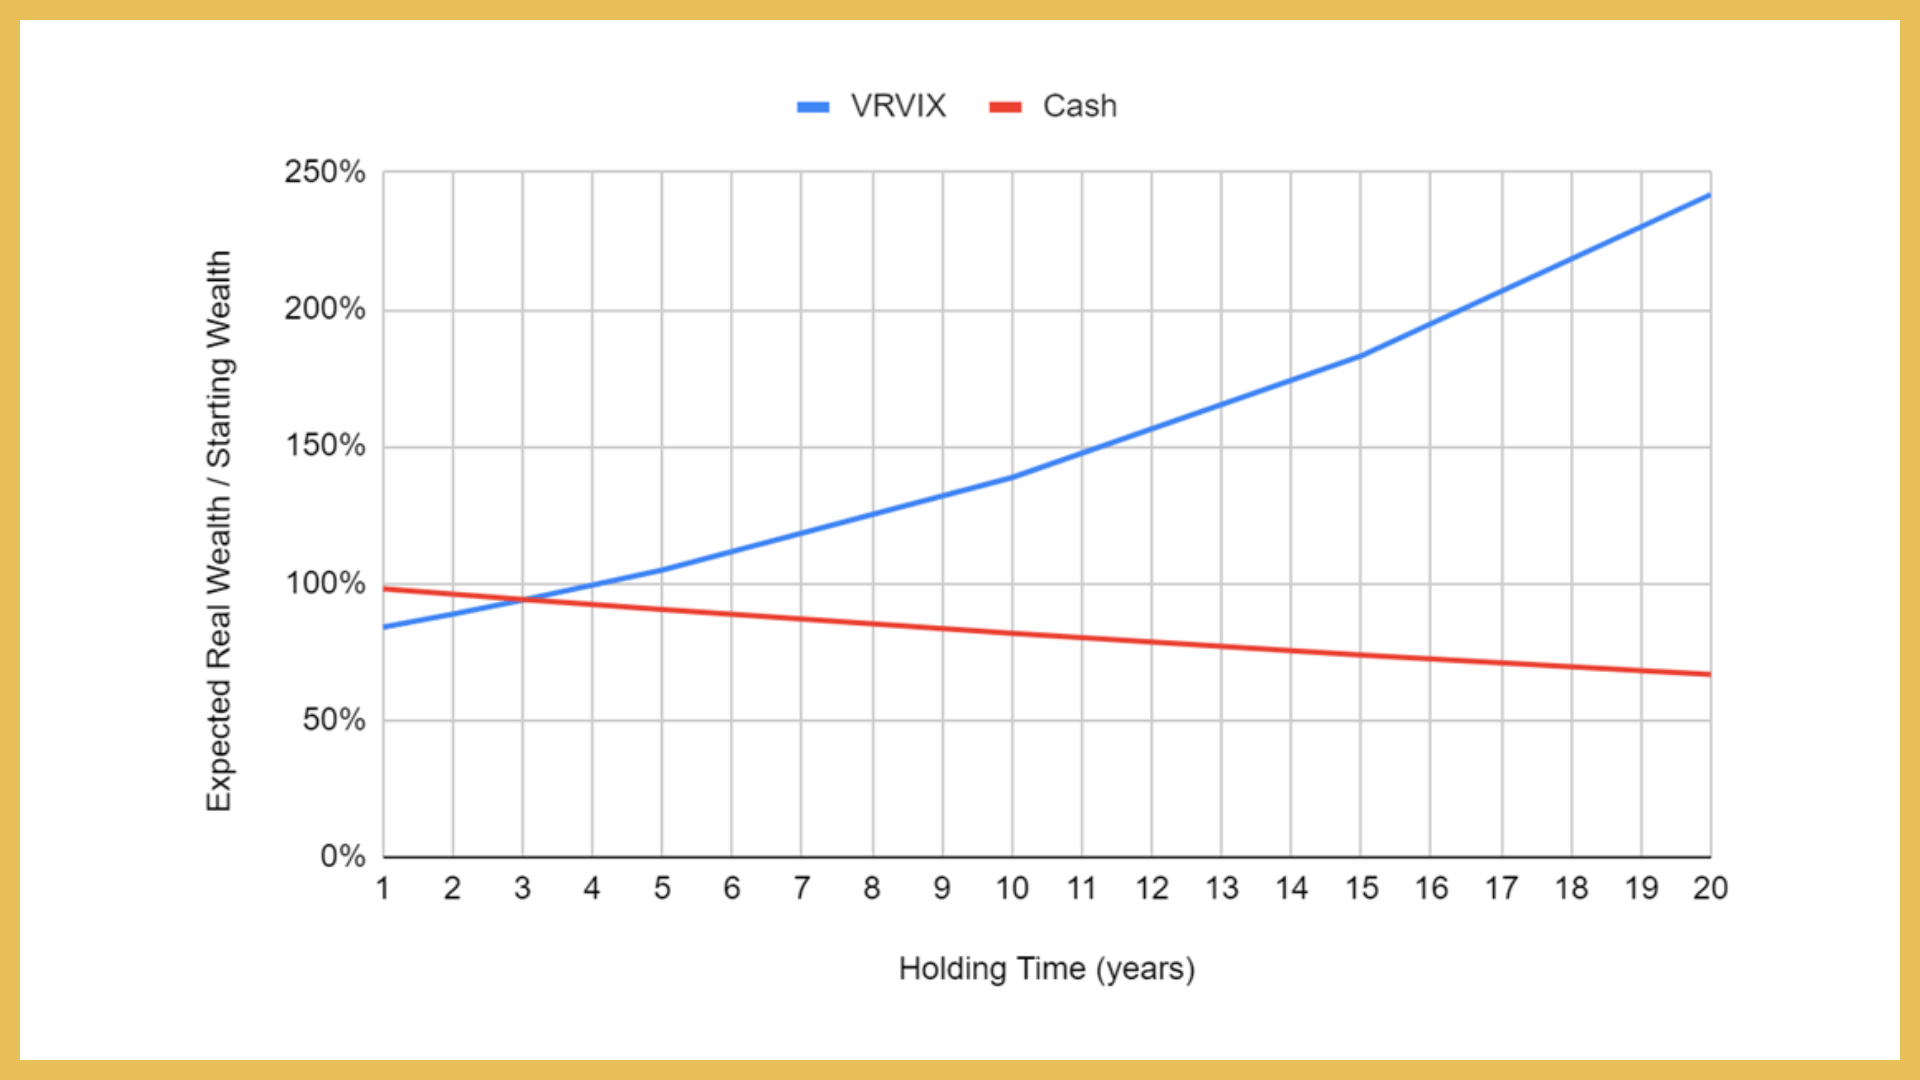
Figure 10: Expected Value of a VVIAX Investment vs. Cash for Various Holding Times (assumes a 2% per year loss of purchasing power in cash)
This chart is quite informative. It shows that out to periods of about 3 years it is expected for stocks to perform worse than cash. Please note that the use of the word expected here is not the same thing as saying certain. If it was certain then it wouldn’t make sense to hold stocks at all! The usefulness of this chart is that it tells us that for expenses we intend to make within 3 years the probabilities suggest that saving in cash is the wise choice. Even if we’re guaranteed to lose purchasing power in cash it’s likely we’ll lose less than we will in stocks. For expenses further, than 3 years out the odds favor saving for those in stocks.
How would one use such information? It’s pretty simple. Forecast expenses out to 3 years. All of those expenses should be put into cash. The rest should be put into stocks. Again, I’m ignoring gold here only to demonstrate a general framework for decision-making. Notice this is very different from saying “put 20% of your wealth into cash or 30% of it”. The amount allocated to cash should be driven more by how much cash you think you’ll need within 3 years. The rest should be invested so that your purchasing power can be increased long term.
So ignore the Fed minutes. Short-term results are not predictable, by anyone. Think instead in terms of probabilities. The past can inform your choices for the future and the framework I demonstrated here can be used as a guide.
You can buy Paul’s book by clicking here: Evidence-Based Wealth – How to Engineer Your Early Retirement if you are seeking to master your financial destiny so that your life will belong to you and not to your employer?
This book will provide you with enough basic knowledge that you can develop and execute your own program for achieving financial freedom at an early age. It will also expose you to some fairly advanced tricks and new ways of interpreting financial information, protecting and building wealth, and planning for short and long-term financial goals.
Disclaimer: This article is for educational and entertainment purposes only. All opinions and information are for demonstrational purposes and do not constitute investment advice. This information is being presented without understanding your specific circumstances or financial situation. If you need advice, please contact a qualified financial adviser, tax accountant, or an attorney, in your country before making any financial decisions.