One of the biggest risks an income-oriented investor faces is a large decline in dividend income. There are different approaches used to mitigate such a risk. In this article, I will share with you how to guard against systemic dividend decline. One popular approach is to carefully screen dividend stocks and only invest in those which satisfy certain income and balance sheet requirements (e.g. dividend coverage ratio, free cash flow growth, etc.). Another approach is to select from a list of stocks that have had a stellar track record of dividend payments such as the Dividend Aristocrats and Dividend Kings. These are great strategies for minimizing the probability that a portfolio will experience a sudden and unexpected decline in dividend income; however, there is always a general weakness in economic conditions that results in a systemic decline in dividend payments even among stocks that are members of the elite Dividend Aristocrats. For example, the financial crisis that hit between the years 2007 and 2009 took a heavy toll on the aristocracy. Of the 59 members of the Dividend Aristocrats which entered the crisis, 23 had departed (cut their dividend) within 5 years. Included in the list of the fallen were stalwarts: General Electric, Bank of America, Progressive, State Street, Pfizer, Eli Lilly, Pitney Bowes, and a host of others. Thus, even careful security selection cannot guard against a severe decline in business conditions. That is what makes such an event systemic.
As unlikely as it may seem that another such systemic event will occur, the fact that it has occurred in the (recent) past suggests it is prudent to take steps to guard against it. If careful security selection is not sufficient to guard against systemic dividend decline, what can be done to avoid either having to sell shares or reduce a person’s standard of living? The answer is to have a sufficient cash position entering such an episode. This article will explore the size of the cash cushion needed and it will use the data of the 2007-2009 financial crisis as a “laboratory” of sorts.
I am going to use a broadly diversified fund of high yielding dividend payers as the subject of this study. There are many choices available. I beg the indulgence of the reader if I pick one that is not their favorite. For this study I have chosen VYM, Vanguard’s FTSE High Dividend Yield Index ETF. I believe it is representative of the magnitude and duration of systemic dividend decline a carefully constructed income portfolio might exhibit. It also has the advantage of having an inception date prior to the financial crisis, which many low fee dividend index funds do not have.
The following chart illustrates the dividend income produced by the fund. I constructed this chart using the quarterly per share dividend payments of VYM. Each quarterly payment I adjusted using the consumer price index for all urban consumers (CPI). The numbers are shown in 2022 Q2 dollars. In other words, the purchasing power of the quarterly dividends have been adjusted to current dollars at the time of this writing. To smooth out the data and make the trend easy to see I calculated the trailing income from the prior year. So the point for March of 2008 is the sum of CPI adjusted dividend payments from June of 2007 to March of 2008. Similarly, the point for June of 2022 is the sum of CPI adjusted payments from September 2021 to June 2022.
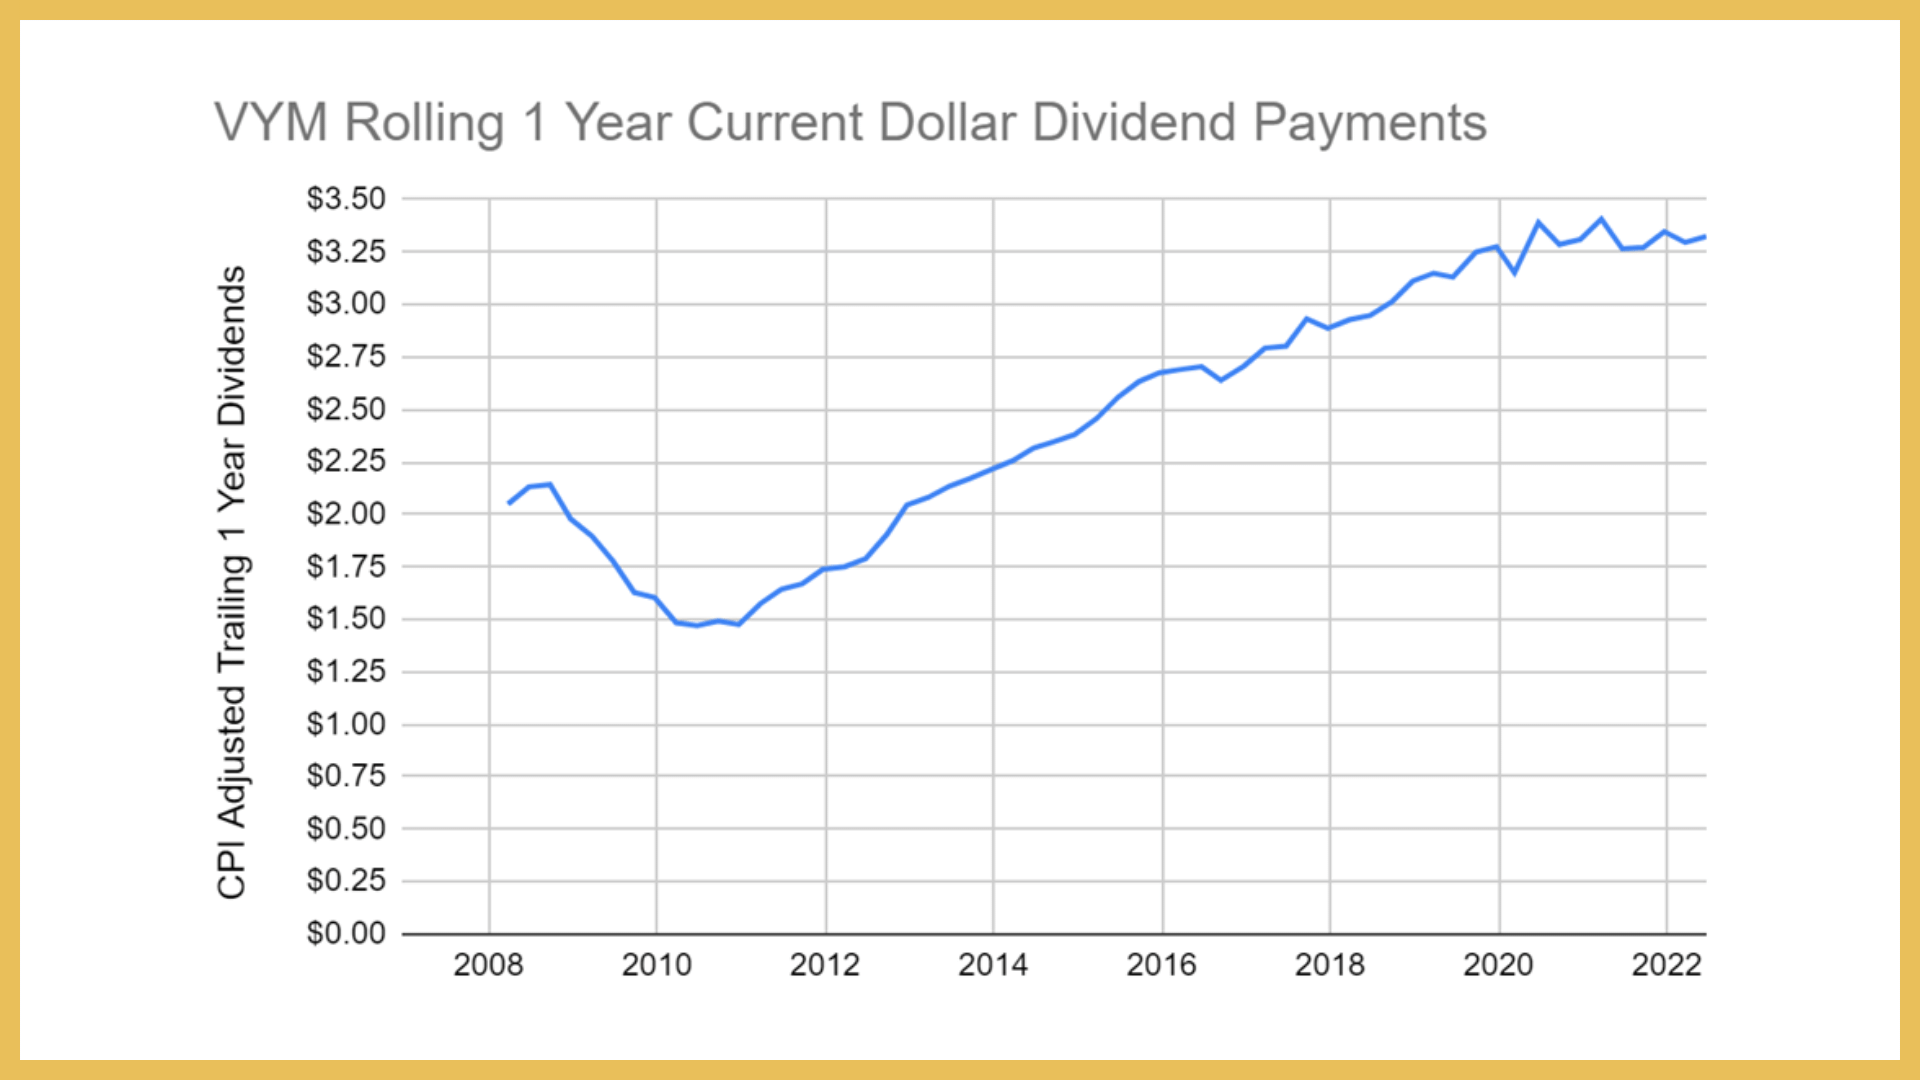
One can immediately see the issue. Suppose in the middle of 2008 a person owned enough of this fund to produce $40,000 per year of (current $) income, or roughly 20,000 shares. Along with other sources of income, such as Social Security, it was decided this was enough to begin a long and comfortable retirement. Great! Unfortunately, due to extraordinary bad timing, this person would see their yearly annual real dividend income decline by over 30 percent during the first two years of retirement (31.3% peak to trough). To make matters worse the real dividends did not recover until 2013. So our case study in unfortunate timing had to deal with roughly five years of reduced dividend payments. This is certainly not a tragedy if they were able to live comfortably with two thirds of the expected dividend income, but this inconvenience can be avoided with the use of a cash cushion. How big of a cash cushion would have been required? Let’s answer that question now.
If our investor was making $40,000 in trailing CPI adjusted yearly dividends at the peak in mid 2008 it would have required 18,673 shares. This was a point in time when real trailing dividends were $2.14 per share. The investor wants to continue to spend $40,000 per year, which is conveniently $10,000 per quarter. In June of 2008 VYM paid out a current dollar dividend of $0.504 per share, which when multiplied by 18,673 shares is $9,408. This is almost a $600 deficit for the quarter, which is not too bad. In September 2008 the next dividend was declared. It’s real value was $0.501 per share, or $9,347 in total paid to the investor. The quarterly income gap grew, but it still wasn’t horrendous. December rolled around and the investor received $8,609 in current dollar dividends. If the investor didn’t have a pot of cash on the side then he or she would either have to start thinking about reducing spending or selling some shares.
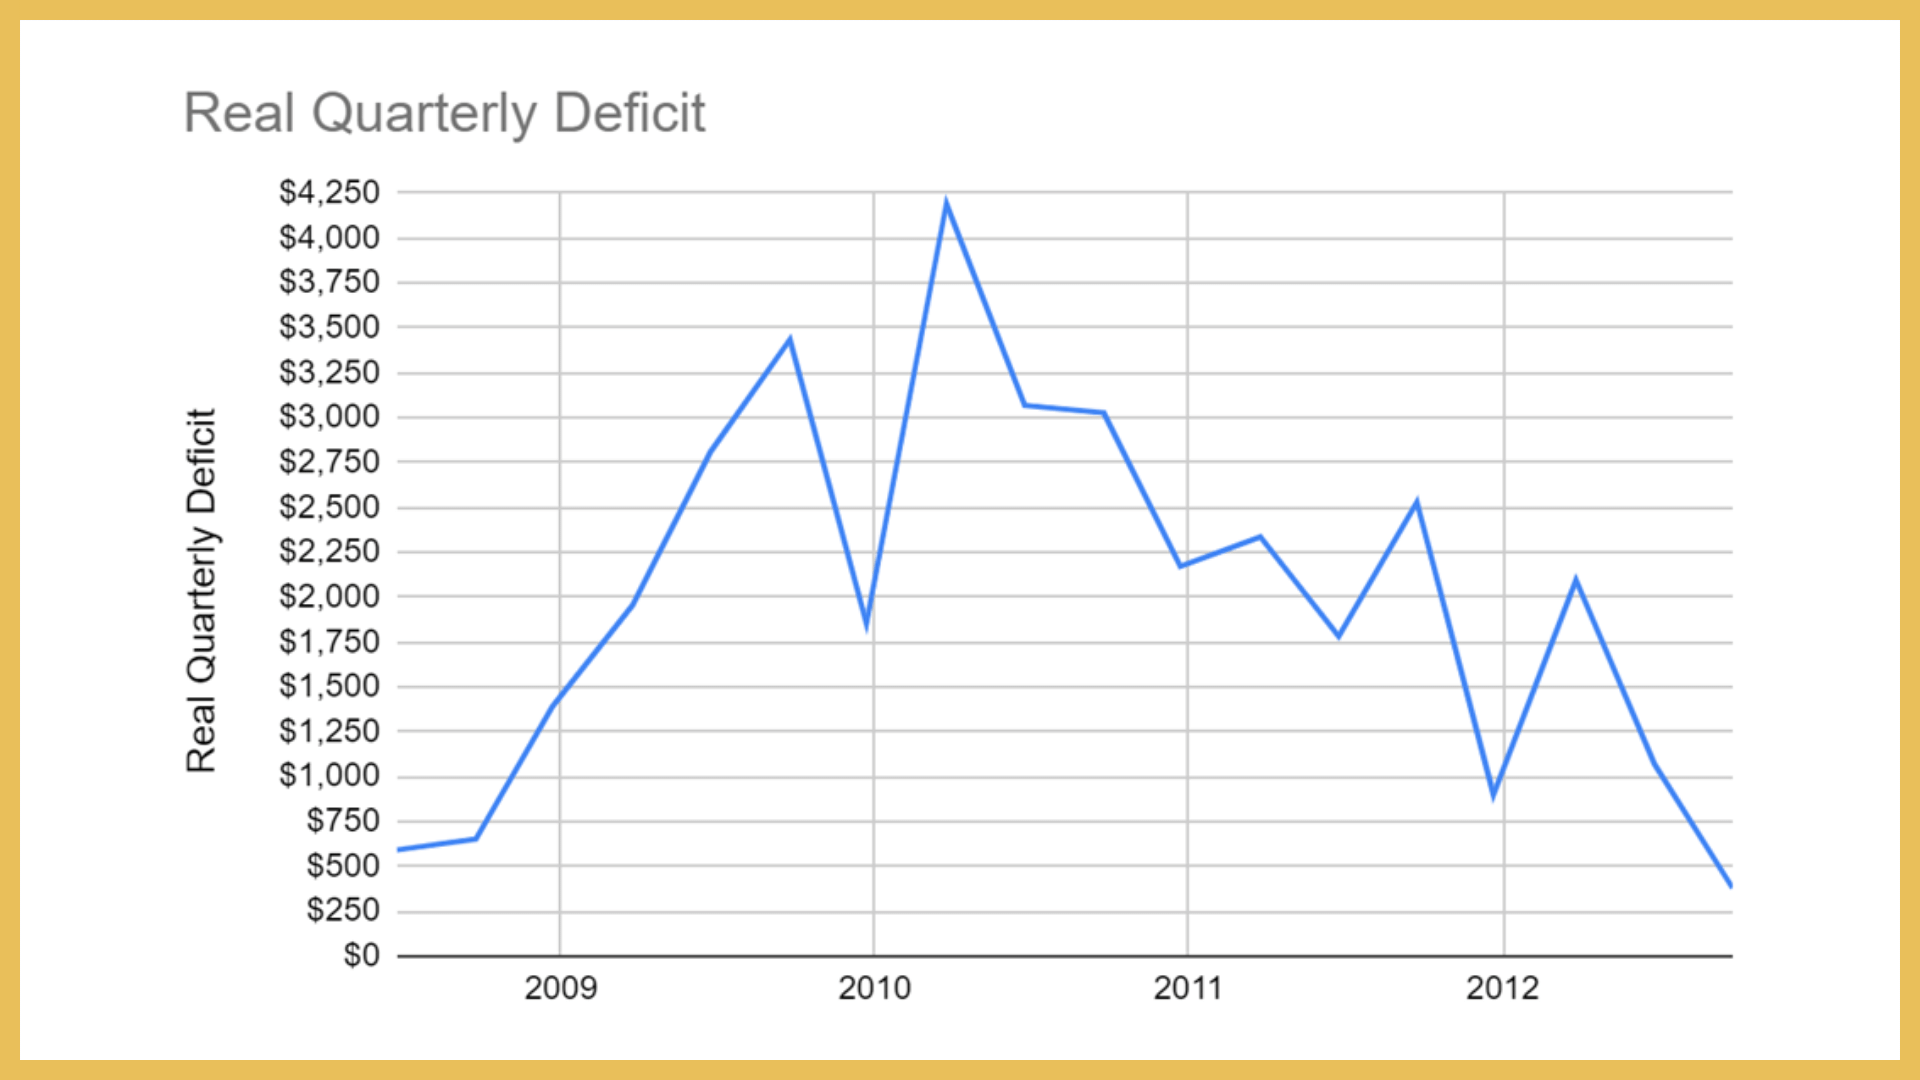
The figure below shows how much of a real deficit our investor would have experienced each quarter up to the time when dividend payments recovered. Adding all of these deficits up, we find that the cumulative deficit is $36,238. Compared to the $40,000 of yearly dividends the investor was expecting at the beginning of retirement this represents nearly a full year of payments. Over the 5 years that followed retirement the investor, instead of seeing a steadily growing stream of income, lost about 20% of his or her initial income.
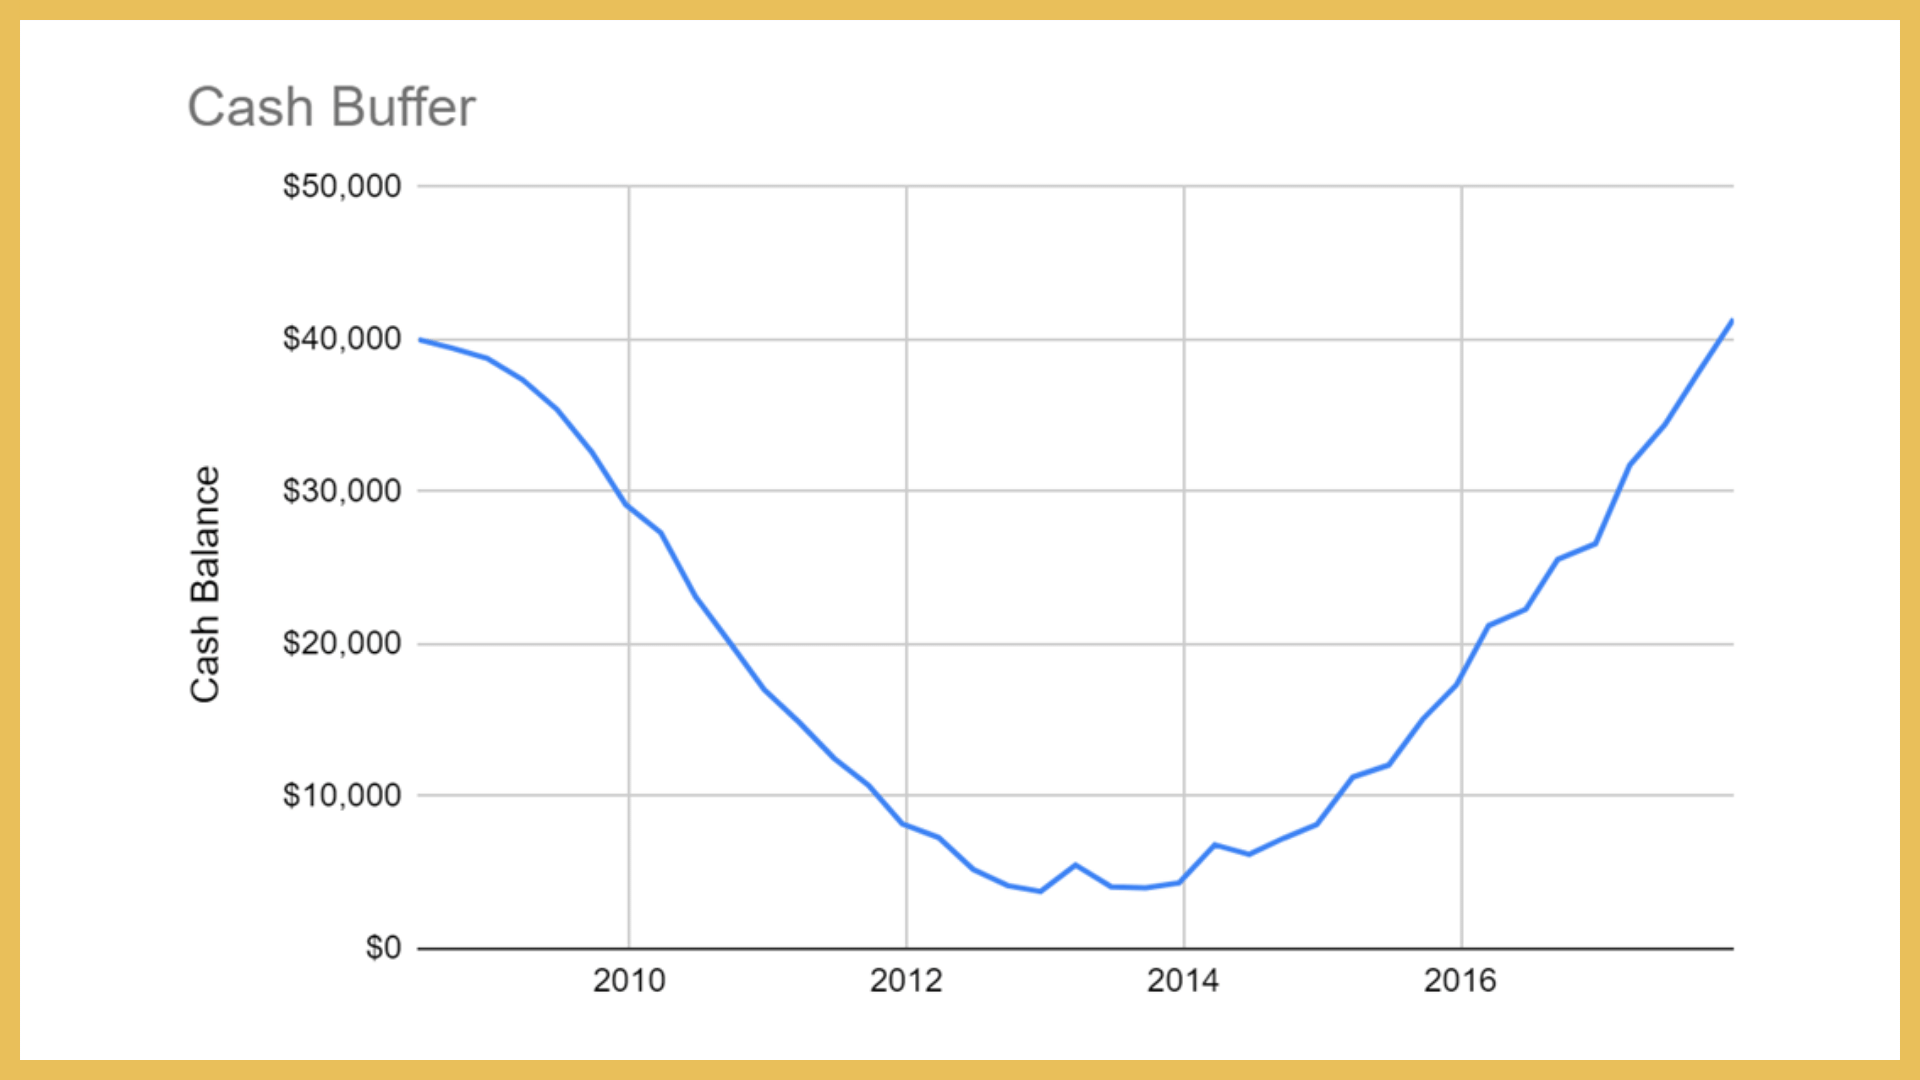
With perfect foresight our investor would have known to have saved at least one year of cash (two is safer!). The chart below illustrates what would have happened if our investor had started with one year worth of dividends in the bank. Each quarter he or she would have drawn down the cash balance by the amount of the deficit. In this way the quarterly spending of $10,000 could be maintained. Notice that the cash balance declined to nearly zero in 2013 as expected. Remember, 2013 was the point at which dividends payments had just about recovered to their pre-crisis levels. Of course, 2013 is not where the story ends. Our investor is now left with a mostly depleted bank account. In order to build this account back up to its prior levels our investor would have needed to divert surplus dividend income into the bank to prepare for the next systemic crisis. By December 0f 2017 the bank account was fully restored to its original $40,000 of purchasing power. We can see that full recovery from a systemic crisis can be a decade long experience!
What can we conclude from all of this? First, while it is possible to take action to avoid dividend cuts it is impossible (without clairvoyance) to avoid a moderate reduction in dividend income resulting from a systemic event. Second, even a diversified portfolio may see a decline in dividend income of 30% or more. While some may be prepared to ride out the storm by reducing living standards, a simple solution for avoiding a reduction in living standards is to bank one or more years worth of dividend income. This can serve to buttress an income portfolio so that living standards can be maintained without the need to sell shares.